GBP/USD drops amid strong US Dollar, lower rate hike BoE’s expectations
- Initial GBP/USD gains, driven by upbeat UK retail sales data, were counteracted by increased strength in the US Dollar.
- Latest UK inflation report led to a repricing of BoE’s interest rates expectations, with a 50% chance of a 50 bps rate hike now projected by the swaps market.
- Robust US data, particularly lower-than-expected unemployment claims, reignited worries about the Federal Reserve (Fed) tightening monetary conditions post the upcoming meeting.

GBP/USD continued to drop late in the North American session following upbeat data in the United Kingdom (UK), but the market turned south as news emerging from Japan strengthened the greenback, which appreciated against most G7 currencies. The GBP/USD trades at 1.2851, losing 0012%, after hitting a daily high of 1.2904.
GBP/USD retreats from a high of 1.2904 following strong performance from the US dollar and lowered expectations of a significant rate hike from the Bank of England
News emerging during the Asian session triggered flows toward the US Dollar, as a Reuters report revealed the Bank of Japan (BoJ) would stick to its YCC program and maintain its dovish stance. That tumbled the GBP/USD, which had risen towards the 1.2900 mark after upbeat retail sales data in the UK, but overall US Dollar strength weighed on the GBP/USD.
Additionally, the most recent inflation report in the UK eased pressure on the Bank of England (BoE), which was expected to lift rates 50 bps at the August 3 meeting. However, inflation cooling down triggered a repricing of BoE’s interest rates expectations, with analysts backpedaling, as shown by the swaps market depicting a 50% chance of a 50 bps rate hike.
Across the pond, solid data from the United States (US), particularly last week’s unemployment claims, reignited concerns the Federal Reserve (Fed) will tighten monetary conditions after the following week’s meeting. Other data revealed during the day was mixed, with US retail sales missing estimates, but continued to show consumers resilience, while housing market data witnessed a dip after registering positive figures in May.
Meanwhile, expectations the Fed would raise rates past the July meeting surged to 28%, from last month’s 15.9% odds, as revealed by the CME FedWatch Tool.
Consequently, the greenback rose, registering more than 1% weekly gains. As of writing, the US Dollar Index (DXY), a measure that tracks the performance of the US Dollar against six peers, sits at 101.052, which advances 0.23%, on Friday.
The GBP/USD could remain sideways ahead of the FOMC’s monetary policy meeting. However, if Fed Chair Powell strikes a hawkish tone at his press conference, that could weigh on the GBP/USD before the BoE’s August 3 meeting.
GBP/USD Price Analysis: Technical outlook
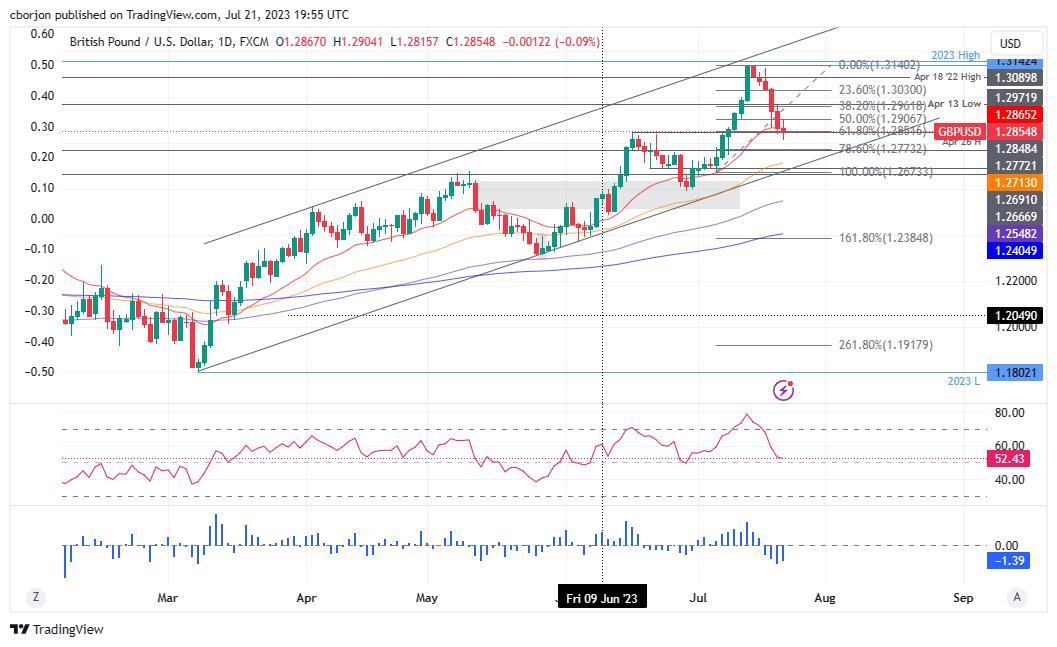
The daily chart portrays the GBP/USD pair as upward biased, despite losing 1.84% during a pullback from yearly highs of 1.3160 toward 1.2815. In addition, the GBP/USD fall was capped by the 61.80% Fibonacci level at 1.2851, from the Fibo drawn from recent lows of July 6 to the YTD high, with price action forming a spinning-top candle, preceded by a bearish candle. If the next candle turns bullish and closes above 1.2906, that would create a three-candlestick chart pattern called ‘morning star,’ warranting further upside expected. In that outcome, the GBP/USD next resistance would be the 38.2% Fibonacci level at 1.2961, followed by a test of the 1.3000 mark.
Conversely, the GBP/USD might consolidate below the 20-day Exponential Moving Average (EMA) at 1.2865, with sellers eyeing the 78.6% Fibonacci retracement at 1.2773.
Author

Christian Borjon Valencia
FXStreet
Markets analyst, news editor, and trading instructor with over 14 years of experience across FX, commodities, US equity indices, and global macro markets.