GBP/USD: Critical support at 1.3880 appears at risk on BOE, Scottish elections – Confluence Detector

GBP/USD is catching fresh bids above 1.3900, heading closer towards the Bank of England’s (BOE) ‘Super Thursday’ events. The UK central bank is unlikely to alter its monetary policy settings, although it could offer a brighter economic outlook, courtesy of a successful vaccination campaign. The traders are likely to pay close attention to any hints on tapering from the BOE, although such a move is unlikely, given that inflation still remains weak and way below the central bank’s 2% target. While much of the economic optimism is already discounted, the Scottish election could be a key risk to the pound’s upside alongside the BOE announcements.
Read: Bank of England Preview: Three reasons why Super Thursday could become a sterling suffer-fest
How is GBP/USD positioned on the technical graphs?
GBP/USD Price Chart: Key resistance and support levels
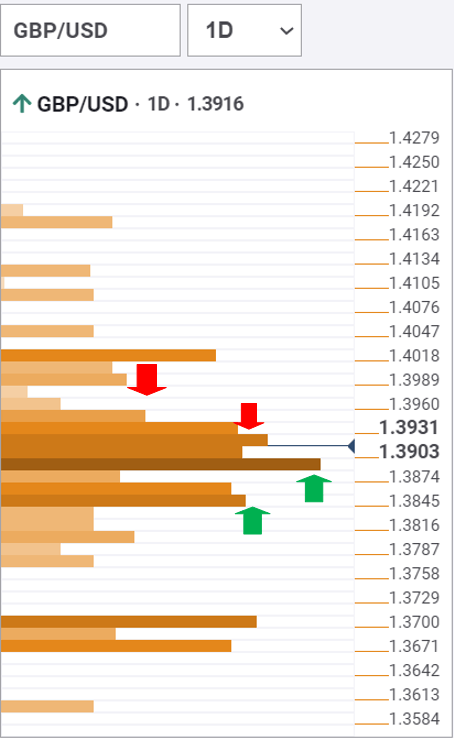
The Technical Confluences Detector shows that GBP/USD is battling strong resistance near the 1.3925/30 region, which is the convergence of the Fibonacci 38.2% one-day and Fibonacci 61.8% one-week.
The next relevant upside cap is seen around 1.3950, the intersection of the pivot point one-week R1 and pivot point one-day R2.
Further, the previous week high at 1.3976 could challenge the bullish commitment before the cable sets its eyes on the 1.4000 round figure.
Alternatively, the powerful support at 1.3880 is the level to beat for the GBP bears. At the point, the previous day low, Fibonacci 38.2% one-month and SMA100 four-hour coincide.
If the latter is breached on a sustained basis, a sharp drop towards 1.3860/50 cannot be ruled out. That support area is the confluence of the Fibonacci 161.8% one-day, Fibonacci 23.6% one-week and SMA50 one-day.
Here is how it looks on the tool
About Technical Confluences Detector
The TCD (Technical Confluences Detector) is a tool to locate and point out those price levels where there is a congestion of indicators, moving averages, Fibonacci levels, Pivot Points, etc. Knowing where these congestion points are located is very useful for the trader, and can be used as a basis for different strategies.
Author

Dhwani Mehta
FXStreet
Residing in Mumbai (India), Dhwani is a Senior Analyst and Manager of the Asian session at FXStreet. She has over 10 years of experience in analyzing and covering the global financial markets, with specialization in Forex and commodities markets.


