GBP/USD continuing to slide, testing waters below 1.2250
- The GBP/USD tumbled on a dovish BoE on Thursday.
- Mixed PMIs for the US saw the USD take a step back, but Pound Sterling traders couldn't capitalize.
- UK Retail Sales missed the mark, keeping the GBP in a bearish stance.

The GBP/USD is looking for further downside to end the trading week, probing chart space below 1.2250 heading into the final hours of Friday's trading session.
The UK's Bank of England (BoE) came in dovish this week after British inflation came in much lower than previously anticipated. The BoE held its benchmark rate at 5.25%, waffling on a market-expected 25-basis-point increase to 5.5%.
UK Retail Sales on Friday missed expectations, printing at 0.4%. The figure rebounded from the previous reading of -1.1%, but failed to capture the market forecast of 0.5%.
UK Purchasing Manager Index (PMI) figures mixed towards the downside, capping any upside potential for the Pound Sterling (GBP).
The preliminary UK S&P Global/CIPS Composite PMI for September declined to 46.8, missing the expected increase to 48.7. The previous month's PMI came in at 48.6.
The manufacturing component of the UK PMI came in better than expected at 48.9 versus the forecast 48.0, but the services sector PMI declined to 47.2 compared to the forecast 49.2.
On the US side, PMIs also came in mixed. The composite ticked lower to 50.1 from 50.2. The manufacturing PMI jumped to 48.9 from the previous 47.9, while the services component slipped to 50.2 from 50.5 and walking back the expected uptick to 50.6.
Read more:
BoE holds interest rate steady at 5.25% in split vote
UK Preliminary Services PMI declines to 47.2 in September vs. 49.5 expected
US S&P Global Manufacturing PMI improves to 48.9, Services PMI declines to 50.2 in September
GBP/USD technical outlook
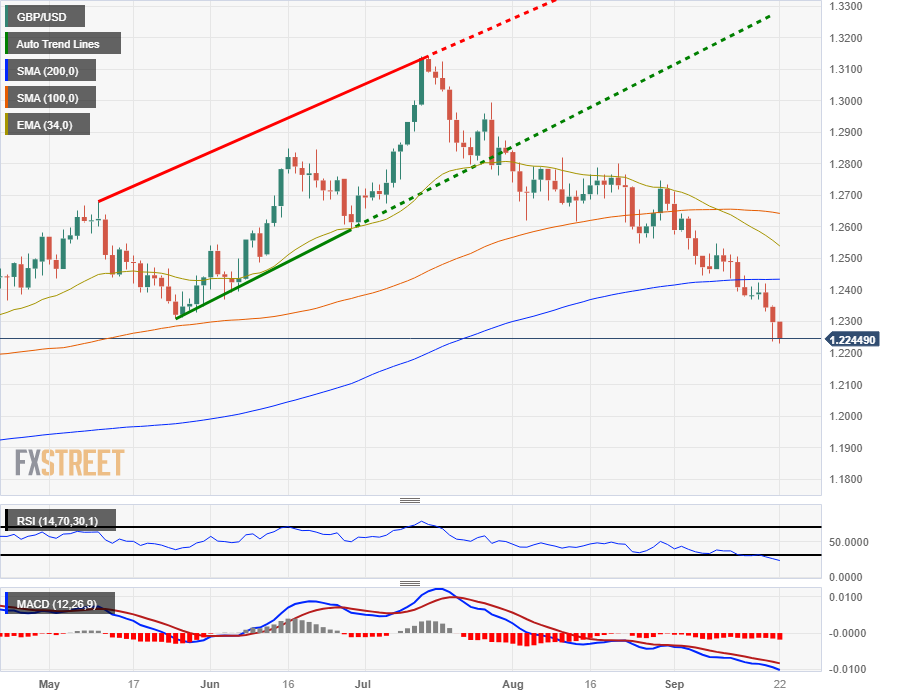
The Pound Sterling continues to struggle against the US Dollar, with the GBP/USD down almost 1.5% from the week's high near 1.2425.
The pair briefly pierced the 100-hour Simple Moving Average (SMA) on Wednesday but has fallen to the downside, now trading beneath the 34-hour Exponential Moving Average (EMA) currently drifting to the low side of 1.2280.
Daily candlesticks have the GBP/USD piercing the 200-day SMA just above 1.2400, and continued downside will see the pair set to challenge six-month lows, with little technical support between current prices and 2023's lows near 1.1825.
GBP/USD daily chart
GBP/USD technical levels
Author

Joshua Gibson
FXStreet
Joshua joins the FXStreet team as an Economics and Finance double major from Vancouver Island University with twelve years' experience as an independent trader focusing on technical analysis.


