|

GBP/JPY sees thin rebound on Friday, falls just short of 182.00

  • The GBP/JPY catches a soft bid to challenge 182.00 after a week of stubborn losses.
  • The Yen surged on the week, bolstered by a hawkish BoJ.
  • The Guppy heads into next week’s central bank showdown on the low side.

The GBP/JPY eked out a small gain on Friday, finishing the day up a slim tenth of a percent to cap off a trading week of firm declines. The Guppy ends the trading week down a firm two and a third percent from the week’s opening bids near 186.60, hitting a nine-week low of 178.58 amidst Thursday’s broad-market Yen rally.

The Bank of Japan (BoJ) kicked off a wild surge in the Japanese Yen after BoJ Governor Kazuo Ueda struck unusually hawkish tones in the mid-week, hinting that the BoJ could be on pace to begin tightening monetary policy, specifically highlighting the Japanese central bank’s negative rate regime.

Despite the BoJ fearing a collapse in Japanese inflation sometime in 2025, Japanese Core Consumer Price Index (CPI) inflation continues to run hotter than expected, hitting 2.9% for the year into October and chalking in a nineteenth straight consecutive month of inflation outrunning the BoJ's 2% upper target band.

Yen traders picked up the BoJ’s hawkish tone and ran with it, sending the JPY surging across the board. The GBP/JPY tumbled nearly three and a half percent top-to-bottom on Thursday, pushing the pair down into new lows below 178.60.

Next week sees UK labor figures, followed by Japanese manufacturing figures, culminating in 2023’s last rate call from the Bank of England (BoE).

GBP/JPY Technical Outlook

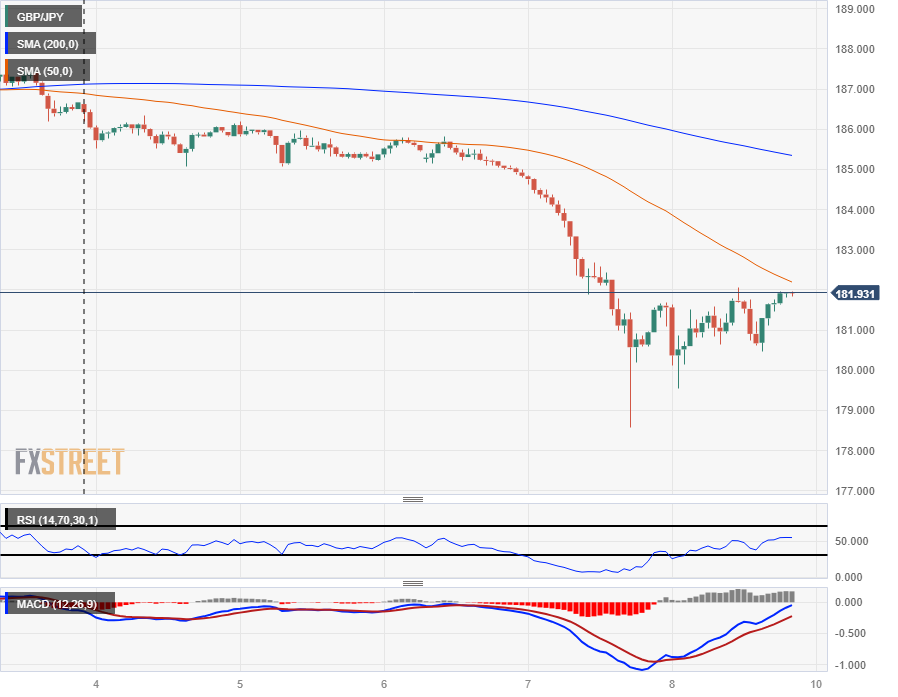
The GBP/JPY’s tumble left the pair knocking into fresh multi-week lows, and Friday’s thin rebound has the Guppy rebounding from the 180.00 major handle.

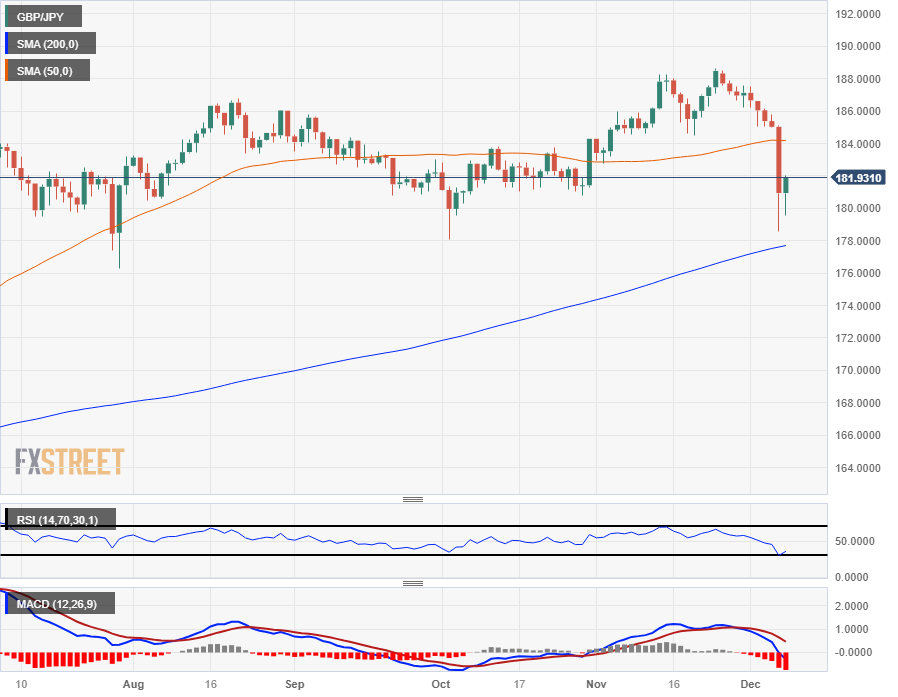
Near-term momentum still leans in favor of the bulls, with technical support coming from the still-untouched 200-day Simple Moving Average (SMA) near 178.00, but the last swing high into 188.66 represents a significant peak that bidders will struggle to retake.

The GBP/JPY is at risk of re-entering a consolidation phase around the 50-day SMA near the 184.00 price level, and short sellers will have their work cut out for them to try and cut the recovery rally short.

GBP/JPY Hourly Chart

GBP/JPY Daily Chart

GBP/JPY Technical Levels

GBP/JPY

Overview
Today last price181.93
Today Daily Change0.99
Today Daily Change %0.55
Today daily open180.94
 
Trends
Daily SMA20186.41
Daily SMA50184.19
Daily SMA100183.76
Daily SMA200177.61
 
Levels
Previous Daily High185.09
Previous Daily Low178.59
Previous Weekly High188.53
Previous Weekly Low186.2
Previous Monthly High188.67
Previous Monthly Low182.75
Daily Fibonacci 38.2%181.07
Daily Fibonacci 61.8%182.61
Daily Pivot Point S1177.99
Daily Pivot Point S2175.04
Daily Pivot Point S3171.49
Daily Pivot Point R1184.49
Daily Pivot Point R2188.04
Daily Pivot Point R3191

Author

Joshua Gibson

Joshua joins the FXStreet team as an Economics and Finance double major from Vancouver Island University with twelve years' experience as an independent trader focusing on technical analysis.

More from Joshua Gibson
Share:

Editor's Picks

AUD/USD eyes 0.7150 barrier nine-day EMA

AUD/USD inches higher after registering modest losses in the previous day, trading around 0.7130 during the Asian hours. The technical analysis of the daily chart indicates that the pair is moving sideways within the rectangle pattern, suggesting a consolidation as neither the bulls nor the bears have enough momentum to take control of the market.

USD/JPY trades below 160.00 intervention threshold; bullish bias intact

The USD/JPY pair attracts some sellers during the Asian session amid fears that authorities will step in again to prop up the Japanese Yen. Furthermore, the Israel-Lebanon truce prompts some profit-taking around the US Dollar and exerts downward pressure on the currency pair.

Gold defends 200-day SMA at $4,425, but for how long?

Gold is attempting a tepid recovery toward $4,500 early Thursday, as renewed optimism in the Mideast geopolitical front calms market nerves. This cautious optimism across Asian markets weighs on Oil prices, and diminishes the US Dollar’s safe-haven appeal, helping Gold stage a decent comeback from the weekly low of $4,424.


Hyperliquid: ETF demand, capital rotation fuel HYPE rally as Bitcoin melts

Hyperliquid price sustains an upward trend near its all-time high of $75.76 on Thursday after posting 80% gains in May, while Bitcoin (BTC) retraces below $65,000, triggering a market-wide panic.

Kevin Warsh takes the Fed helm: What it means for the US Dollar
The Federal Reserve moves away from the highly predictable "forward guidance" model of the Jerome Powell era to a new “Kevin Warsh environment”, characterized by less communication, more policy surprises, and an increased focus on the Fed's complex balance sheet.
Recession on paper: What really moves the Canadian Loonie now?

Statistics Canada handed the headline writers a gift and the analysts a headache. Real GDP shrank 0.1% on an annualized basis in the first quarter, and with the fourth quarter of 2025 revised down to a 1.0% contraction, that is two negative quarters in a row, the textbook definition of a technical recession and Canada's first since the pandemic.

GBP/JPY sees thin rebound on Friday, falls just short of 182.00