|

GBP/JPY reclaims the 182.00 handle on Friday bump and run

  • The GBP/JPY is seeing a bounce from near-term lows at 181.30 to settle out the trading week in familiar consolidation.
  • Market sentiment is seeing a step back from safe havens, but lack of momentum in risk assets is limiting topside.
  • UK Retail Sales missed, capping off recovery gains for the Guppy.

The GBP/JPY is set to finish out the trading week on the north side of 182.00 with late Friday price action sifting around 182.20 after a broad-market sentiment rally is seeing safe haven assets take a step back, pushing down the Japanese Yen (JPY) and giving the Pound Sterling (GBP) to recover some ground.

UK Retail Sales flopped on release, printing at -0.9% for September compared to August's 0.4%, completely missing the forecast -0.3% and sending the Pound Sterling down to 181.30 against the Yen.

Early Friday saw the Japanese National Consumer Price Index (CPI) for September hit an annualized 3% versus August's 3.2% reading for the same period, but market reaction was limited as the national inflation figure gets front-run by the Tokyo CPI reading which came in late September.

GBP/JPY Technical Outlook

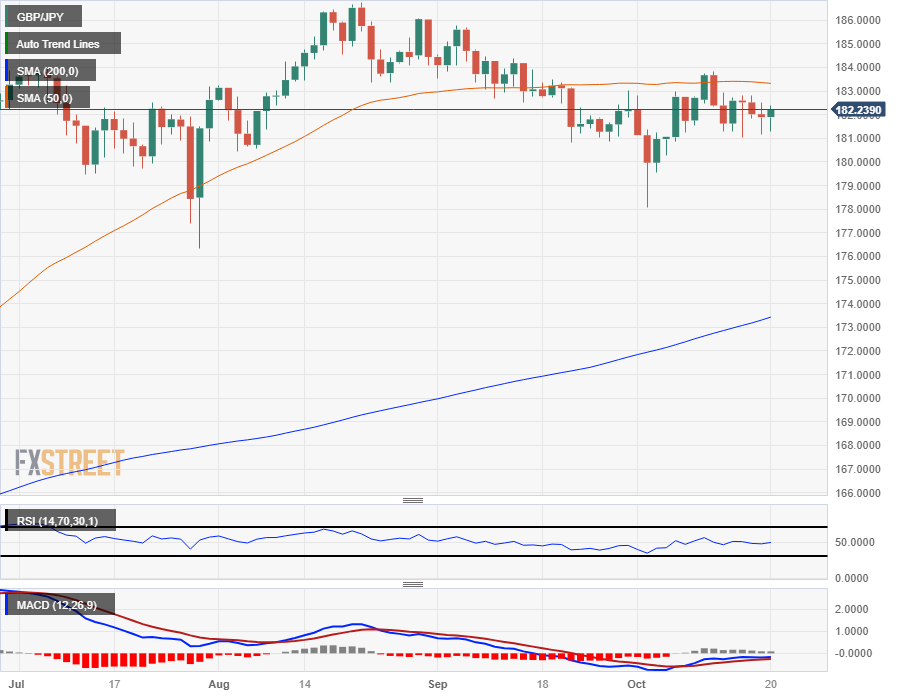
Momentum continues to bleed out of the GBP/JPY on daily candlesticks, with the pair trading close or into the 50-day Simple Moving Average (SMA) near 183.30 since first declining into the 183.00 handle in September, and near-term consolidation has seen the Guppy trading into previous day levels for most of October.

The GBP/JPY's constraining pattern leaves the pair adrift at the top end of the year's highs, and the Pound Sterling remains up over 17% from 2023's bottom bids set back in January near 155.35.

With bullish opportunities quickly evaporating, any strength from the JPY will send the Guppy back down the charts in short order, with long-term technical support sitting at the 200-day SMA currently parked just below 174.00.

GBP/JPY Daily Chart

GBP/JPY Technical Levels

GBP/JPY

Overview
Today last price182.17
Today Daily Change0.27
Today Daily Change %0.15
Today daily open181.9
 
Trends
Daily SMA20181.89
Daily SMA50183.36
Daily SMA100182.01
Daily SMA200173.31
 
Levels
Previous Daily High182.52
Previous Daily Low181.18
Previous Weekly High183.82
Previous Weekly Low181.26
Previous Monthly High185.78
Previous Monthly Low180.82
Daily Fibonacci 38.2%181.69
Daily Fibonacci 61.8%182.01
Daily Pivot Point S1181.21
Daily Pivot Point S2180.52
Daily Pivot Point S3179.86
Daily Pivot Point R1182.55
Daily Pivot Point R2183.21
Daily Pivot Point R3183.9

Author

Joshua Gibson

Joshua joins the FXStreet team as an Economics and Finance double major from Vancouver Island University with twelve years' experience as an independent trader focusing on technical analysis.

More from Joshua Gibson
Share:

Editor's Picks

AUD/USD consolidates above 0.7000/two-month low; bearish potential intact

The AUD/USD pair oscillates in a narrow range during the Asian session, and moves little following the release of mixed inflation figures from China. Spot prices currently trade around the 0.7025 region, nearly unchanged for the day, and remain within striking distance of a nearly two-month low set on Tuesday. Renewed hostilities between the US and Iran temper hopes for a deal to end the over three-month-old war.

Japanese Yen languishes despite wholesale inflation accelerates in May

USD/JPY flatlines after experiencing volatility, trading around 160.40 during the Asian hours on Wednesday. The pair continues to hold its ground, reflecting a struggling Japanese Yen that has failed to find support despite a massive acceleration in wholesale inflation. Driven by surging energy costs linked to the ongoing Middle East conflict, Japan’s Producer Price Index jumped 6.3% year-over-year in May. This hot printing comfortably outpaced April’s upwardly revised 5.3% figure and surpassed market consensus of 5.5%, marking the fastest pace of wholesale price growth in three years.

Gold languishes near March low, below $4,200 as traders await US CPI report

Gold maintains its heavily offered tone through the first half of the European session and currently trades near its lowest level since March 23, around the $4,180-$4,175 region. Renewed hostilities between the US and Iran fuel inflationary concerns and bolster bets for more hawkish central banks, driving flows away from the non-yielding yellow metal. The decline could also be attributed to technical selling following the recent breakdown below the very important 200-day SMA and seems unaffected by a softer US Dollar, which tends to benefit the commodity.

Cardano's downtrend deepens despite on-chain bottoming signals

Cardano edges lower to $0.1600 signaling a potential extension of the 30% loss from last week. The altcoin remains under intense selling pressure, weighing on its retail support. Still, a spike in dormant supply re-entering circulation signals that the selling pressure has run its course, a pattern that often precedes a rebound.

US CPI data set to show inflation at three-year high in May, backing Fed hawkish tilt

The US Bureau of Labor Statistics will publish the May Consumer Price Index (CPI) data on Wednesday. The report is expected to show another step up in consumer inflation, driven by the persistently high Oil prices due to the ongoing crisis in the Middle East.

The US economy defies the rules: 100 days into the Oil shock and the recession signal is still missing

More than three months after the start of the Iran war and the resulting disruption to global energy markets, the US economy continues to display remarkable resilience. The conflict has triggered a sharp rise in Oil prices, reignited inflationary pressures and fueled widespread concerns about a potential economic slowdown.

GBP/JPY reclaims the 182.00 handle on Friday bump and run