|

GBP/JPY Price Analysis: Stumbles below 161.00 on risk-off impulse, breaking crucial support areas

  • After facing solid resistance at a confluence of EMAs, the GBP/JPY it slid 0.51% on Thursday.
  • GBP/JPY: For a bearish resumption, a break below 160.00 is needed; otherwise, buyers would remain hopeful of testing 161.00.

The GBP/JPY slides, after hitting the year-to-date (YTD) high at 162.17, retraces and breaks crucial support levels during the last couple of days as bears drive the GBP/JPY pair toward the 160 handle. At the time of writing, the GBP/JPY exchanges hand at 160.59 as Friday’s Asian Pacific session begins.

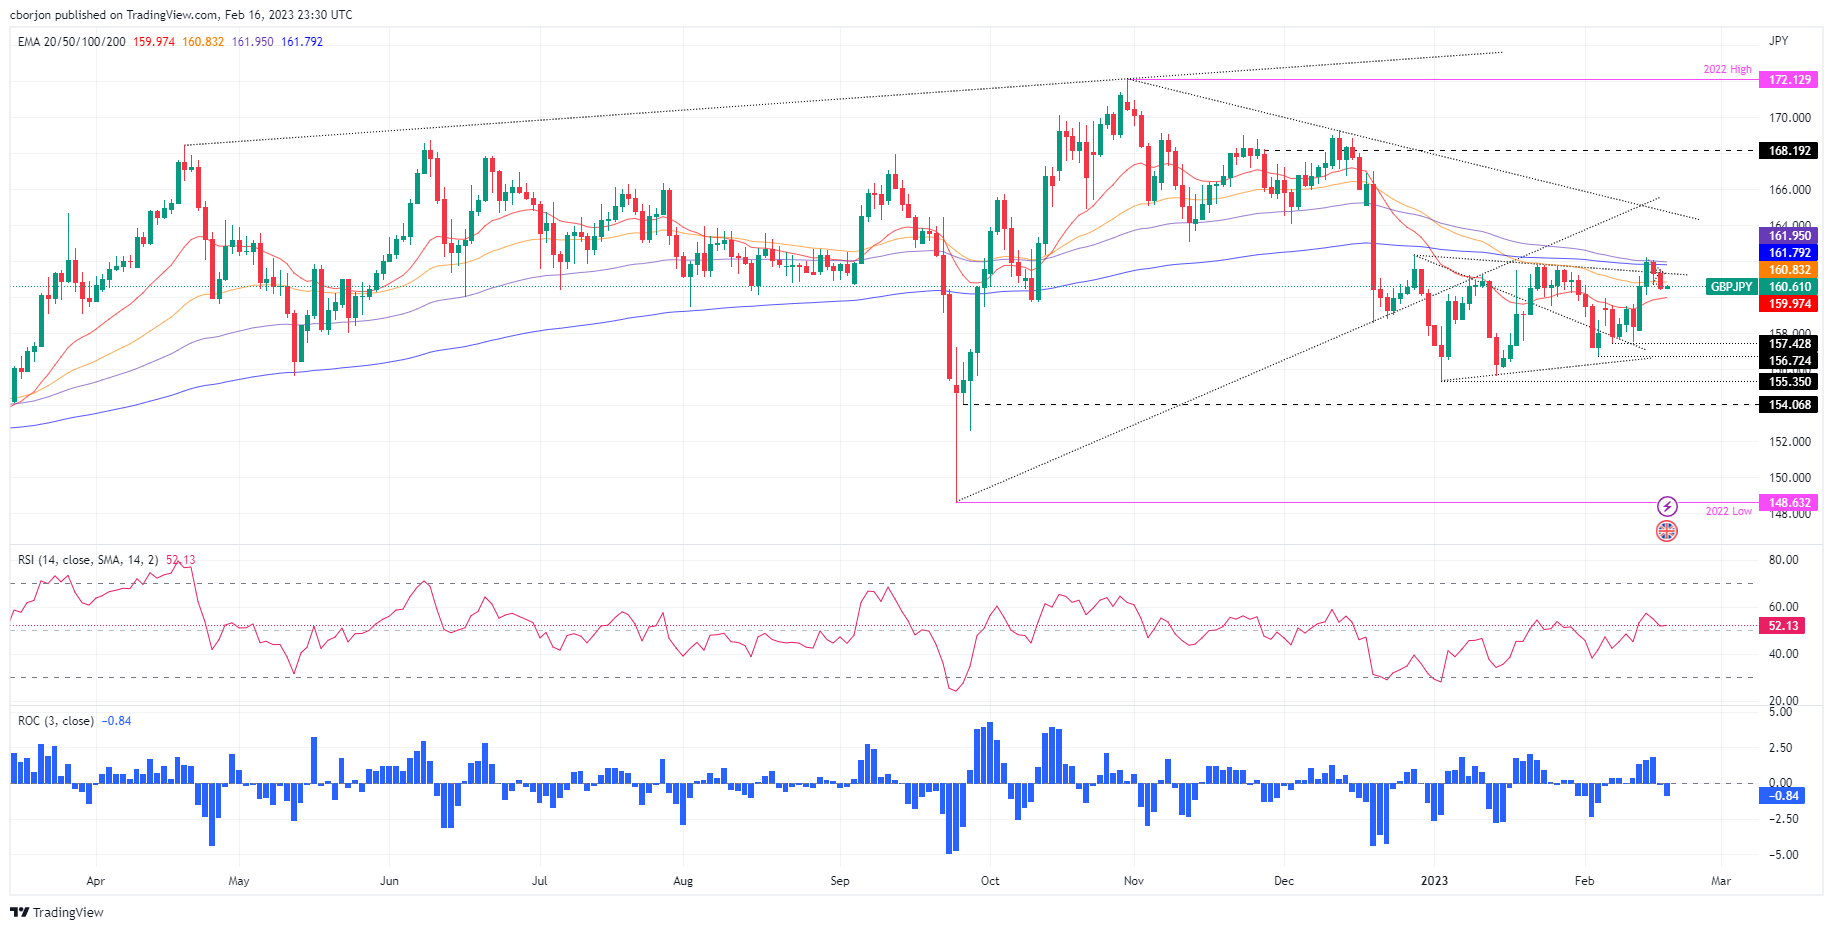
Long-term, the GBP/JPY daily chart indicates the pair is neutrally biased after facing a solid resistance area, with the 50, 200, and 100-day Exponential Moving Averages (EMAs), each at 160.83, 161.79, and 161.95, respectively. However, buyers could not hold the GBP/JPY prices at around the previously mentioned EMAs, which opened the door for further losses.

The Relative Strength Index (RSI) shifted course, and after peaking at 58, its slope turned south, while the Rate of Change (RoC) shows that sellers moved in as the GBP/JPY dived towards the 160.60 area.

For a bearish resumption, the GBP/JPY first support will be the psychological 160.00 figure. A breach of the latter will expose the 20-day EMA at 159.97, followed by the 159.00 figure and the February 13 swing low at 158.18.

As an alternate scenario, if the GBP/JPY pair edges north and reclaims the 50-day EMA at 160.83, that would pave the way for testing the 161.00 mark. Once cleared, that will expose the 200 and 100-day EMAs on the GBP/JPY way towards 162.00.

GBP/JPY Daily chart

GBP/JPY Key technical levels

GBP/JPY

Overview
Today last price160.65
Today Daily Change-0.74
Today Daily Change %-0.46
Today daily open161.39
 
Trends
Daily SMA20159.98
Daily SMA50160.87
Daily SMA100163.6
Daily SMA200163.24
 
Levels
Previous Daily High162.12
Previous Daily Low160.79
Previous Weekly High159.96
Previous Weekly Low157.43
Previous Monthly High161.85
Previous Monthly Low155.36
Daily Fibonacci 38.2%161.3
Daily Fibonacci 61.8%161.61
Daily Pivot Point S1160.75
Daily Pivot Point S2160.1
Daily Pivot Point S3159.42
Daily Pivot Point R1162.07
Daily Pivot Point R2162.76
Daily Pivot Point R3163.4

Author

Christian Borjon Valencia

Markets analyst, news editor, and trading instructor with over 14 years of experience across FX, commodities, US equity indices, and global macro markets.

More from Christian Borjon Valencia
Share:

Editor's Picks

EUR/USD risks a deeper drop below 1.1750

EUR/USD keeps its vacillating mood in place as the the NA session drwas to a close on Tuesday, hovering below the 1.1800 hurdle amid acceptable gains in the US Dollar. In the meantime, market participants and the FX galaxy are expected to closely follow President Trump’s SOTU speech around 2AM GMT.
 

GBP/USD regains 1.3500 and above

GBP/USD extends its advance for the third day in a row on Tuesday, this time retesting the area beyond the 1.3500 hurdle. Cable’s uptick comes despite decent gains in the Greenback and the dovish message from the BoE’s Bailey at the UK Parliament.

Gold appears offered around $5,150

Gold is giving back a good portion of the recent multi-day rally, receding to the $5,150 zone per troy ounce amid the decent bounce in the US Dollar and mixed US Treasuty yields. In the meantime, markets’ attention remain on upcoming comments from Fed speakers.

Australia CPI to highlight persistent price pressures, backing a hawkish outlook

Australia will release its key set of inflation figures for the month of January on Wednesday, with the Consumer Price Index expected to rise by 3.7%, slightly lower than the 3.8% in the last month of 2025.

The Citrini report: How a debatable AI narrative can shake Wall Street

That AI-related headline alone was enough to rattle investors.US stocks slid sharply on Monday after a widely circulated Citrini Research memo outlined a hypothetical “2028 Global Intelligence Crisis”, warning that rapid AI adoption could push US unemployment into double digits as early as by mid-2028.

XRP pressured by weak ETF flows and declining retail interest

Ripple (XRP) is edging lower, trading above its intraday low of $1.32 at the time of writing on Tuesday. The decline from its weekly opening of $1.39 reflects heightened volatility in the broader cryptocurrency market, accentuated by tariff-triggered uncertainty.