|

GBP/JPY Price Analysis: Sellers step in and trips the pair below the 20-EMA, eyeing 165.00

  • The GBP/JPY closed in June with solid gains of almost 2%, as depicted by the weekly chart.
  • From the daily chart perspective, the GBP/JPY is upward biased, but the pair tumbling below the 20-day EMA exposes the GBP/JPY to further selling pressure.
  • GBP/JPY in the near term is neutral-downward biased and might accelerate its losses if sellers reclaim 164.65.

The British pound ended June with gains of almost 2% against the Japanese yen, but on the last trading day of the month, it recorded a loss of 0.19%, extending its fall to three straight days in the middle of a dampened market mood. At the time of writing, the GBP/JPY is trading at 165.24, barely up 0.04% as the Friday Asian session begins.

On Thursday, the GBP/JPY extended its fall, which began on June 28, when the pair reached a weekly high of around 166.94 and made a U-turn, which sent the pair tumbling towards a June 29 low at 169.39. That said, the GBP/JPY opened near the day’s highs and dropped towards the current week’s low around 164.80.
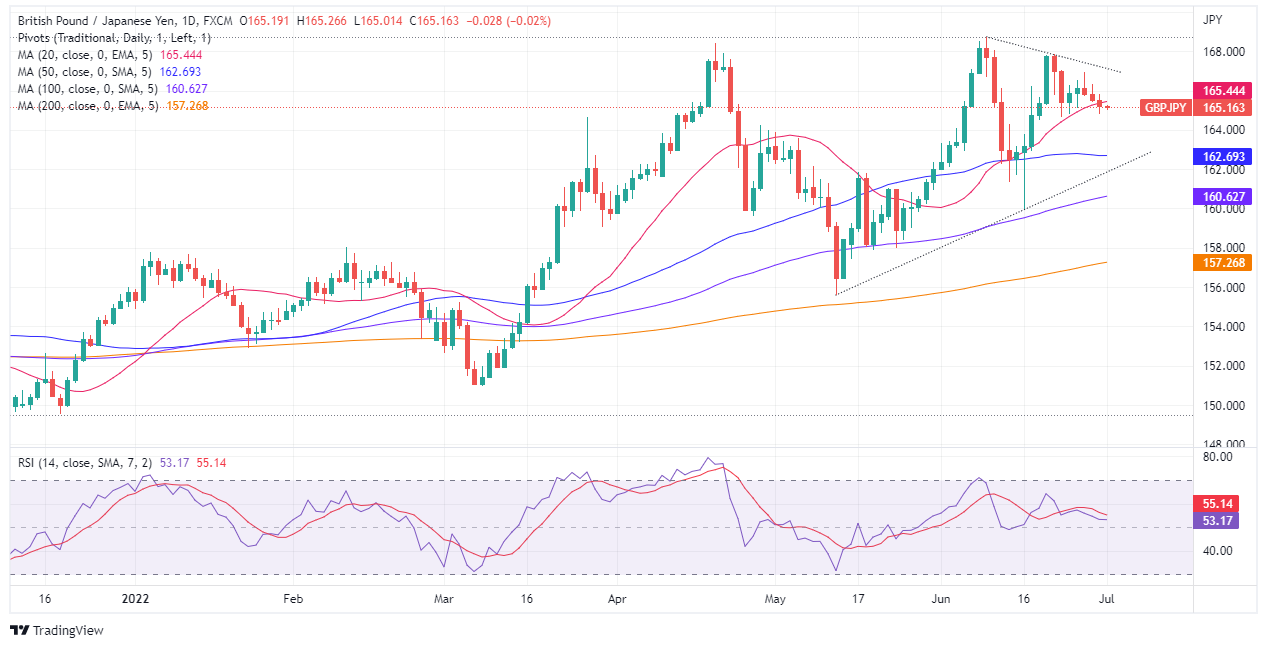
GBP/JPY Daily chart

The GBP/JPY daily chart illustrates the pair as upward biased in the long term, but a break below the 20-day EMA, at 165.44, leaves the cross-currency pair exposed to selling pressure. GBP/JPY sellers need to reclaim the June 23 daily low at 164.65 if they would like to extend the fall. If that scenario plays out, the next support would be the 50-day EMA at 162.69. Otherwise, the GBP/JPY’s first resistance would be the 20-day EMA at 165.44, followed by the June 28 high at 166.94.

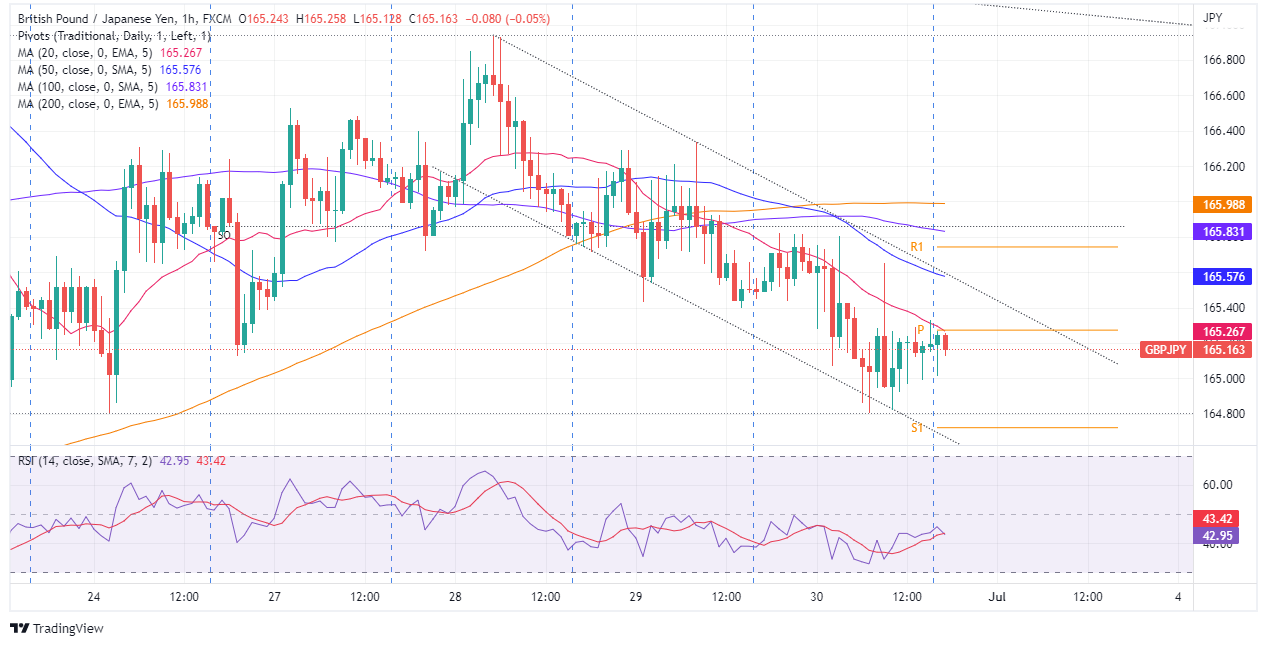
GBP/JPY 1-Hour chart

In the 1-hour chart, the GBP/JPY illustrates a negative story in the short term. Since June 28, the pair fell 1.28%, more than 200-pips, courtesy of the Sterling weakness, which has bolstered the yen. In fact, price action is within a descending channel, showing the formation of a bullish flag. Nonetheless, further losses are expected if the GBP/JPY breaks below 164.65. Otherwise, the GBP/JPY first resistance would be the 20-EMA at 165.26, followed by the R1 daily pivot at 165.83, followed by the 200-EMA at1 65.98.

GBP/JPY Key Technical Level


Overview
Today last price165.14
Today Daily Change-0.44
Today Daily Change %-0.27
Today daily open165.58
 
Trends
Daily SMA20165.36
Daily SMA50162.81
Daily SMA100160.52
Daily SMA200157.19
 
Levels
Previous Daily High166.34
Previous Daily Low165.4
Previous Weekly High167.86
Previous Weekly Low164.48
Previous Monthly High163.91
Previous Monthly Low155.6
Daily Fibonacci 38.2%165.76
Daily Fibonacci 61.8%165.98
Daily Pivot Point S1165.21
Daily Pivot Point S2164.84
Daily Pivot Point S3164.27
Daily Pivot Point R1166.14
Daily Pivot Point R2166.71
Daily Pivot Point R3167.08

Author

Christian Borjon Valencia

Markets analyst, news editor, and trading instructor with over 14 years of experience across FX, commodities, US equity indices, and global macro markets.

More from Christian Borjon Valencia
Share:

Editor's Picks

EUR/USD eyes nine-day EMA barrier after rebounding from 1.1600

EUR/USD gains ground after registering modest losses in the previous session, trading around 1.1620 during the Asian hours on Friday. The technical analysis of the daily chart suggests an ongoing bearish bias as the pair remains within the descending channel pattern.

GBP/USD: Pound Sterling ticks up against US Dollar in countdown to US NFP

The Pound Sterling trades marginally higher to near 1.3365 against the US Dollar during the Asian trading session on Friday. The GBP/USD pair edges up as the US Dollar ticks down ahead of the United States Nonfarm Payrolls data for February, which will be published at 13:30 GMT.

Gold awaits US Nonfarm Payrolls for a clear directional impetus

Gold rebounds above $5,100 early Friday after testing the $5,050 level amid global sell-off. The US Dollar pulls back as profit-taking creeps in ahead of US labor data. For February. 21-day SMA holds amid bullish RSI; a daily closing above 61.8% Fibo is critical for Gold buyers.

Ethereum pull in $169M as validators pile in to stake ETH

US spot Ethereum exchange-traded funds recorded $169 million in net inflows on Wednesday, marking the largest daily intake in two months, according to SoSoValue data. The rise in inflows signals renewed institutional interest in Ethereum amid broader market volatility.

The market compass is pointing at a barrel of Oil

The Asian open is arriving with equities leaning the wrong way, and the reason is not complicated. The market’s compass needle has snapped firmly toward crude. In this tape, oil is not just another input price; it is the gravitational center around which every asset class is orbiting.

Ripple tests recovery strength amid steady ETF inflows, growing retail interest

Ripple (XRP) continues to demonstrate notable resilience as the cryptocurrency market navigates the persistent war in the Middle East after the United States (US) and Israel attacked Iran on Saturday.