- GBP/JPY dropped 0.34%, trading at 185.80, influenced by a dip in US 10-year Treasury bond yield.
- Despite a daily low of 185.52, GBP/JPY is poised to challenge the 187.00 mark amid potential Yen intervention.
- Short-term analysis shows support at Senkou Span B (185.50); a close below 186.00 may signal further declines.
GBP/JPY hits a new year-to-date (YTD) high but retraces as the Japanese Yen (JPY) strengthens during Tuesday’s session and remains the second strongest currency in the day. A drop in the US 10-year Treasury bond yield undermined the USD/JPY pair; hence the GBP/JPY dropped. At the time of writing, the GBP/JPY is trading at 185.80, with losses of 0.34%.
GBP/JPY Price Analysis: Technical outlook
From a daily chart perspective, the GBP/JPY remains upward biased, though it seems that some buyers book profits, as Japanese authorities remain vocal about a possible intervention to boost the Yen. Despite dipping to a daily low of 185.52, the pair would likely test the 186.00 figure, followed by a challenge of the 187.00 psychological level.
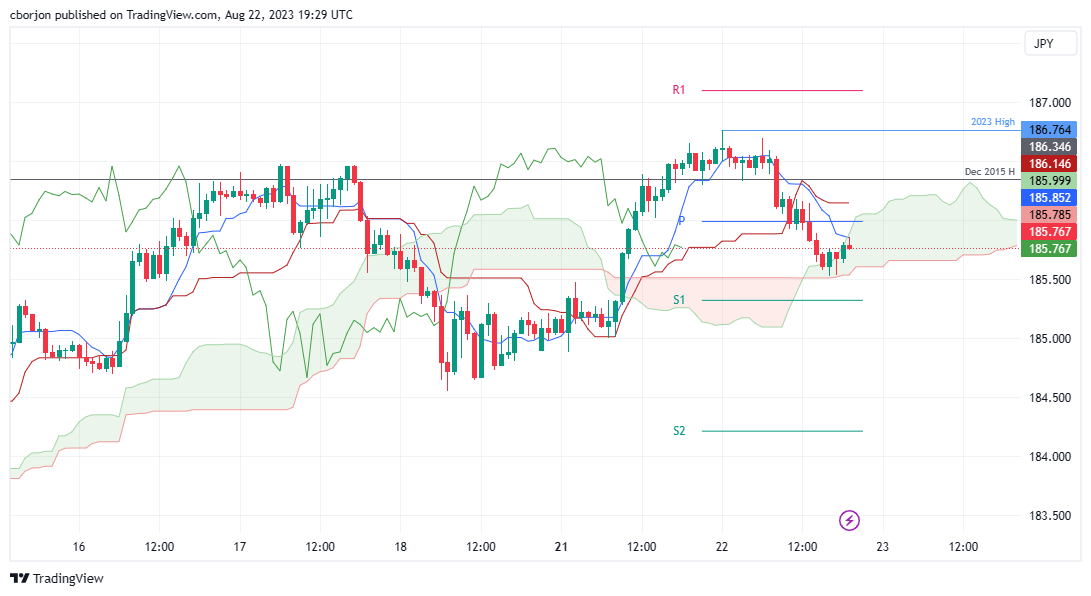
In the short term, the GBP/JPY hourly chart portrays the pair peaked around the new YTD high and retraced below the Asian session low of 186.29, plunging 70 pips toward its daily low. It should be said the GBP/JPY dive was cushioned by the Senkou Span B support at around 185.50; since then, the cross-currency pair edged towards the confluence of the top of the Ichimoku Cloud (Kumo) and the Tenkan-Sen line at 185.85. Once those levels are cleared, the next stop would be the daily pivot point at 185.99. A daily close below 186.00 could pave the way for further losses.
GBP/JPY Price Action – Hourly chart
Information on these pages contains forward-looking statements that involve risks and uncertainties. Markets and instruments profiled on this page are for informational purposes only and should not in any way come across as a recommendation to buy or sell in these assets. You should do your own thorough research before making any investment decisions. FXStreet does not in any way guarantee that this information is free from mistakes, errors, or material misstatements. It also does not guarantee that this information is of a timely nature. Investing in Open Markets involves a great deal of risk, including the loss of all or a portion of your investment, as well as emotional distress. All risks, losses and costs associated with investing, including total loss of principal, are your responsibility. The views and opinions expressed in this article are those of the authors and do not necessarily reflect the official policy or position of FXStreet nor its advertisers. The author will not be held responsible for information that is found at the end of links posted on this page.
If not otherwise explicitly mentioned in the body of the article, at the time of writing, the author has no position in any stock mentioned in this article and no business relationship with any company mentioned. The author has not received compensation for writing this article, other than from FXStreet.
FXStreet and the author do not provide personalized recommendations. The author makes no representations as to the accuracy, completeness, or suitability of this information. FXStreet and the author will not be liable for any errors, omissions or any losses, injuries or damages arising from this information and its display or use. Errors and omissions excepted.
The author and FXStreet are not registered investment advisors and nothing in this article is intended to be investment advice.
Recommended content
Editors’ Picks
AUD/USD on the backfoot, slides below 0.6700

The Australian Dollar registered losses of 0.37% against the US Dollar on Monday, amid rising US Treasury yields that underpinned the Greenback. An upbeat market sentiment could not boost the high-beta Aussie Dollar, which tumbled below the 0.6700 figure. As the Asian session begins, the AUD/USD trades around 0.6668.
EUR/USD eased from 1.0880 on Monday as looming rate differential weighs

EUR/USD eased back from 1.0880 on Monday as talking points from Fed officials weighed on otherwise quiet market flows. Broader markets are keenly anxious for signs of a rate cut from the Fed, but central planners continue to force down expectations with a tricky inflation outlook hobbling the Fed’s options on rate moves.
Gold price extends its upside as investors bet on rate cuts

Gold price extends the rally on Tuesday after retracing from a record high earlier. The renewed gold demand is bolstered by higher bets on interest rate cuts from the US Federal Reserve, ongoing geopolitical tensions, along with the strong demand stemming from central banks and Asian buyers.
Digital asset weekly inflows jump over 600% following response to CPI report

Coinshares weekly report of digital asset flows shows that crypto assets witnessed more than a 600% increase in net inflows last week after US Consumer Price Index saw a softer-than-expected inflation increase.
Will the commodity boom last?

The gold and copper price both hit fresh record highs on Monday. The market is sensitive to these two metals because gold is considered an inflation hedge and a safe haven, and because copper is a metal that is linked to global growth.