|

GBP/JPY Price Analysis: Pulling back within Broadening formation

  • GBP/JPY has likely formed a Broadening topping pattern. 
  • It has just reversed after touching the top of the pattern and looks poised for a down-leg. 
  • The overall long-term trend, however, is bullish with a breakout from the pattern required to reverse. 

GBP/JPY appears to be forming a bearish Ascending Broadening Wedge formation. The pair has just rallied to the pattern’s upper boundary line before forming a double top and pulling back. There is now a good chance it has begun the next down-leg of the pattern. 

A decisive break below support at the 187.96 March 11 lows and the nearby 50-day Simple Moving Average (SMA) would confirm a continuation of the next down leg within the wedge.  

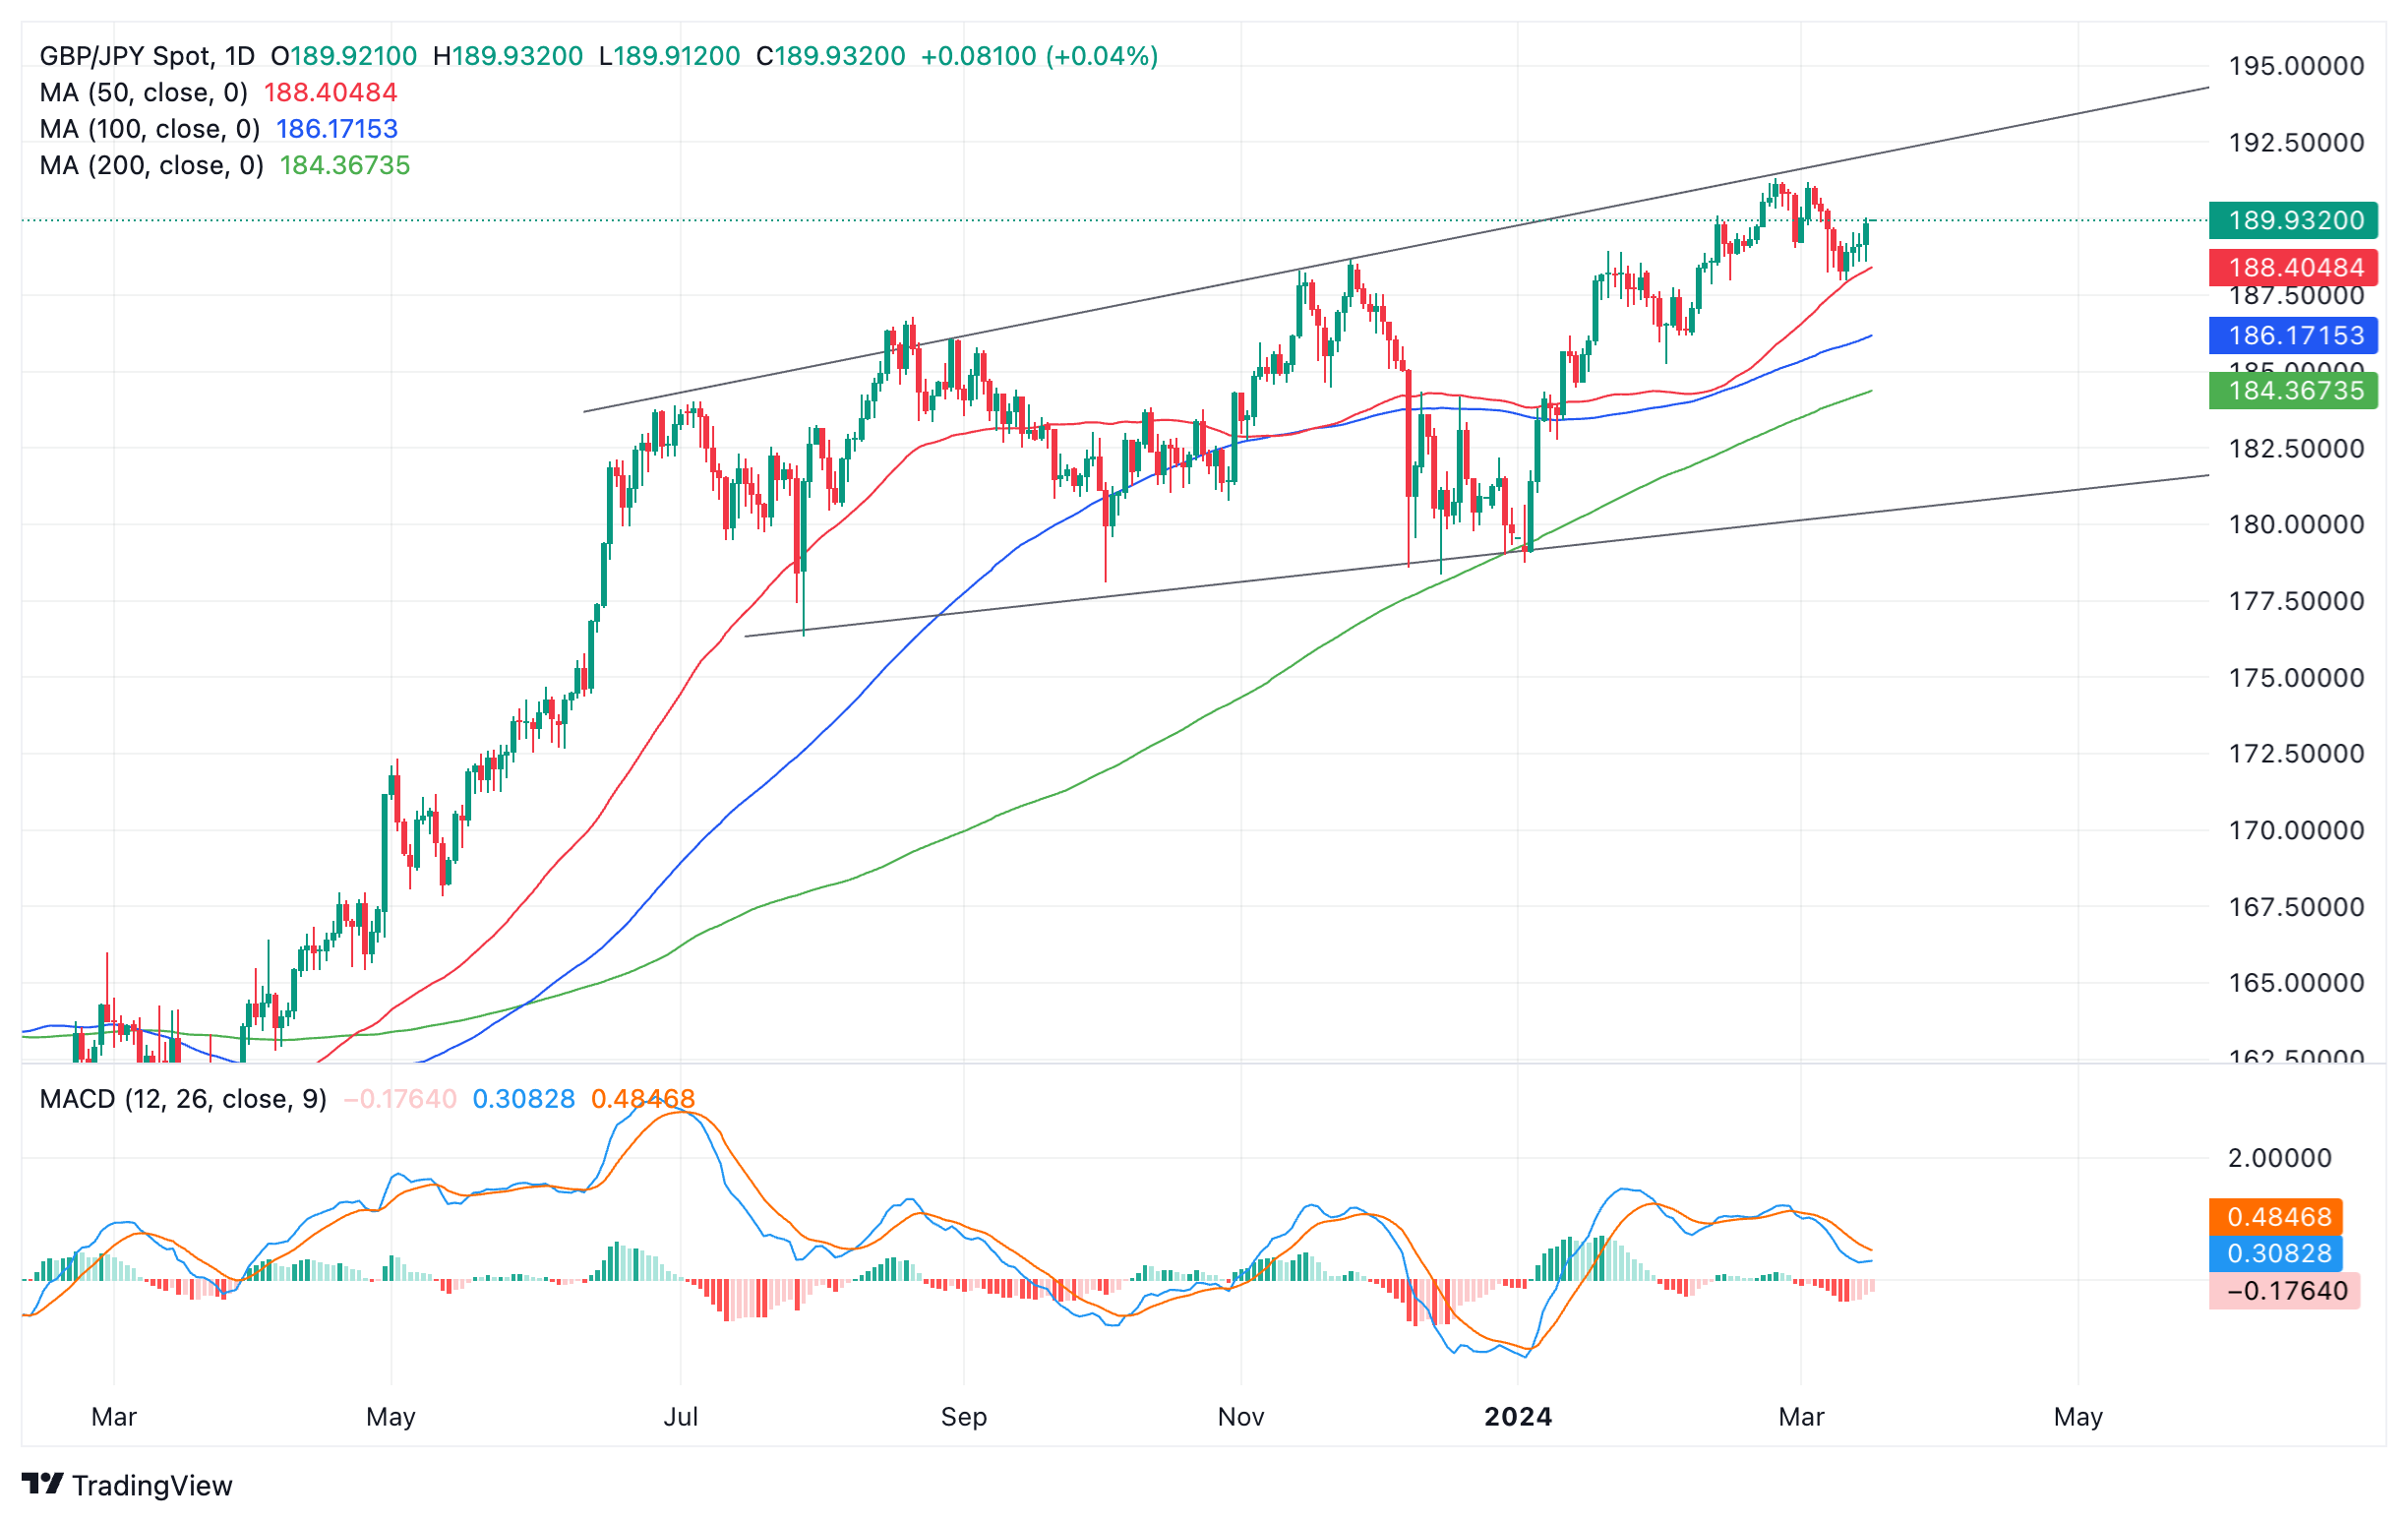
Pound Sterling versus Japanese Yen: Daily chart


Such a move would probably see GBP/JPY fall to support near the 50-week Simple Moving Average (SMA) at 181.60. 

It is worth noting that although a deep correction looks on the cards, over the long-term, the peaks and troughs of price are rising. This likely indicates GBP/JPY is in an overall uptrend, which is likely to continue as long as price does not break completely out of the bottom of the wedge at around 180.80-90. A downside breakout, however, would confirm a reversal of the long-term uptrend. 

A break above the 191.32 highs would provide confirmation the dominant bull trend was intact and continuing higher. Although it looks overstretched, such a move is still possible given the overall bullishness of the chart. The next upside target from there would probably be resistance at the 195.88 highs of 2015.

Author

Joaquin Monfort

Joaquin Monfort is a financial writer and analyst with over 10 years experience writing about financial markets and alt data. He holds a degree in Anthropology from London University and a Diploma in Technical analysis.

More from Joaquin Monfort
Share:

Editor's Picks

EUR/USD extends its optimism past 1.1900

EUR/USD retains a firm underlying bid, surpassing the 1.1900 mark as the NA session draws to a close on Monday. The pair’s persistent uptrend comes as the US Dollar remains on the defensive, with traders staying cautious ahead of upcoming US NFP prints and CPI data.
 

GBP/USD tilts bullish as markets barrel toward mid-week NFP print

GBP/USD is holding a broader bullish structure on the daily chart, with price trading well above the 50 Exponential Moving Average at 1.3507 and the 200 EMA at 1.3310, confirming the intermediate uptrend that has been in place since the November 2025 low near 1.2300. 

Gold pushes back above $5,000

The daily chart shows spot Gold in a parabolic uptrend that accelerated sharply from the $4,600 area in late January, printing a record high at $5,598.25 before a violent reversal erased nearly $1,000 in value during the final days of the month. 

Litecoin eyes $50 as heavy losses weigh on investors

Following a strong downtrend across the crypto market over the past week, Litecoin holders are under immense pressure. The Bitcoin fork has trimmed about $1.81 billion from its market capitalization since the beginning of the year, sending it below the top 20 cryptos by market cap.

Japanese PM Takaichi nabs unprecedented victory – US data eyed this week

I do not think I would be exaggerating to say that Japanese Prime Minister Sanae Takaichi’s snap general election gamble paid off over the weekend – and then some. This secured the Liberal Democratic Party (LDP) an unprecedented mandate just three months into her tenure.

Ripple exposed to volatility amid low retail interest, modest fund inflows

Ripple (XRP) is extending its intraday decline to around $1.40 at the time of writing on Monday amid growing pressure from the retail market and risk-off sentiment that continues to keep investors on the sidelines.