|

GBP/JPY Price Analysis: Pokes support-turned-resistance near 156.00, bulls stay hopeful

  • GBP/JPY reverses previous day’s losses, bounces off three-week-old support line.
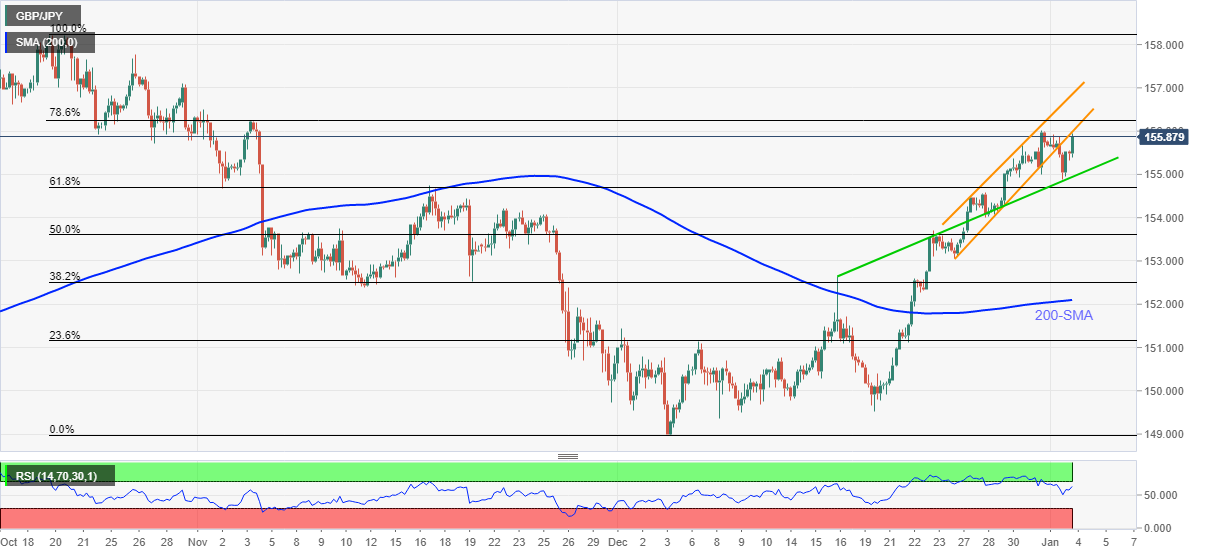
  • Weekly ascending channel, 78.6% Fibonacci retracement guards immediate upside.
  • Bearish need cautious until witnessing clear downside break of 200-SMA.
  • Firmer RSI, sustained trading above key SMA favor bulls.

GBP/JPY rises 0.25% intraday around 155.86, grinding higher at the two-month top during Tuesday’s European morning.

The cross-currency pair snapped a three-day uptrend the previous before bouncing off an ascending support line from December 16. The recovery moves also take clues from firmer RSI, not overbought.

It should be noted, however, that the quote still holds the previous downside break of a one-week-long ascending trend channel, which triggered Monday’s declines.

Hence, a clear upside break of the stated channel’s resistance line, around 156.00 by the press time, becomes necessary for the GBP/JPY buyers to keep reins.

Following that, 78.6% Fibonacci retracement (Fibo.) level of October-December 2021 downside, near 156.25, may offer an intermediate halt during the quote’s rally towards the last year's top of 158.22.

Alternatively, the stated support line, previous resistance, can challenge the intraday GBP/JPY sellers around 155.00. Also adding to the downside filter is the 61.8% Fibo. level near 154.70.

In a case where GBP/JPY drops below 154.70, the early November’s swing low near 152.40 may act as an intermediate halt before directing bears to the 200-SMA level of 152.10.

GBP/JPY: Four-hour chart

Trend: Bullish

Additional important levels

Overview
Today last price155.86
Today Daily Change0.38
Today Daily Change %0.24%
Today daily open155.48
 
Trends
Daily SMA20152.29
Daily SMA50152.93
Daily SMA100152.59
Daily SMA200152.69
 
Levels
Previous Daily High155.93
Previous Daily Low154.89
Previous Weekly High156.02
Previous Weekly Low153.31
Previous Monthly High156.02
Previous Monthly Low148.98
Daily Fibonacci 38.2%155.29
Daily Fibonacci 61.8%155.53
Daily Pivot Point S1154.94
Daily Pivot Point S2154.4
Daily Pivot Point S3153.9
Daily Pivot Point R1155.97
Daily Pivot Point R2156.47
Daily Pivot Point R3157.01

Author

Anil Panchal

Anil Panchal

FXStreet

Anil Panchal has nearly 15 years of experience in tracking financial markets. With a keen interest in macroeconomics, Anil aptly tracks global news/updates and stays well-informed about the global financial moves and their implications.

More from Anil Panchal
Share:

Editor's Picks

EUR/USD looks to regain the 200-day SMA

EUR/USD regains some balance and trade just above 1.1600 the figure ahead of the opening bell in Asia. The pair initially dipped to the 1.1530 zone for the first time since November, always following the stronger US Dollar and the marked flight-to-safety in the context of the ongoing Middle East crisis
 

GBP/USD slips below key averages as geopolitical risks mount

GBP/USD fell about 0.35% on Tuesday, settling around 1.3350 after slipping below the 200-day Exponential Moving Average for the first time since early December. The pair has pulled back sharply from its late-January high near 1.3870, shedding over 500 pips in a series of lower highs and lower lows. 

Gold falls to near $5,100 as inflation fears weigh amidst Middle East conflict

Gold price faces some selling pressure near $5,100 during the early Asian session on Wednesday. The precious metal falls amid a renewed US Dollar demand and dimming prospects for US rate cuts. The US ISM Services Purchasing Managers Index report will be published later on Wednesday. 

Ethereum: Whales step up buying as short positions contract

After holding firm heading into the last weekend, Ethereum whales have returned to action, pouncing on the volatility stemming from escalating military actions between the US and Iran.

Energy shock 2.0: Why rising Gas prices could hit the Euro

Even without a confirmed, sustained disruption, the mere risk to a key global energy chokepoint is enough to inject a significant premium into European Gas markets. And for the Euro, that matters.

Ripple falters amid sell-off jitters and negative funding rates

Ripple (XRP) has come under pressure, drifting lower to $1.35 at the time of writing on Tuesday. The over 2% correction looks poised to erase the previous day’s gains, which lifted the remittance token to $1.42.