GBP/JPY Price Analysis: Head-and-shoulders chart pattern in the H4 targets a fall towards 161.50
- GBP/JPY is registering a minimal loss of 0.06% as the Asian session begins.
- A risk-off impulse, alongside Japanese authorities’ verbal intervention in the FX markets, bolstered the yen against most G8 currencies.
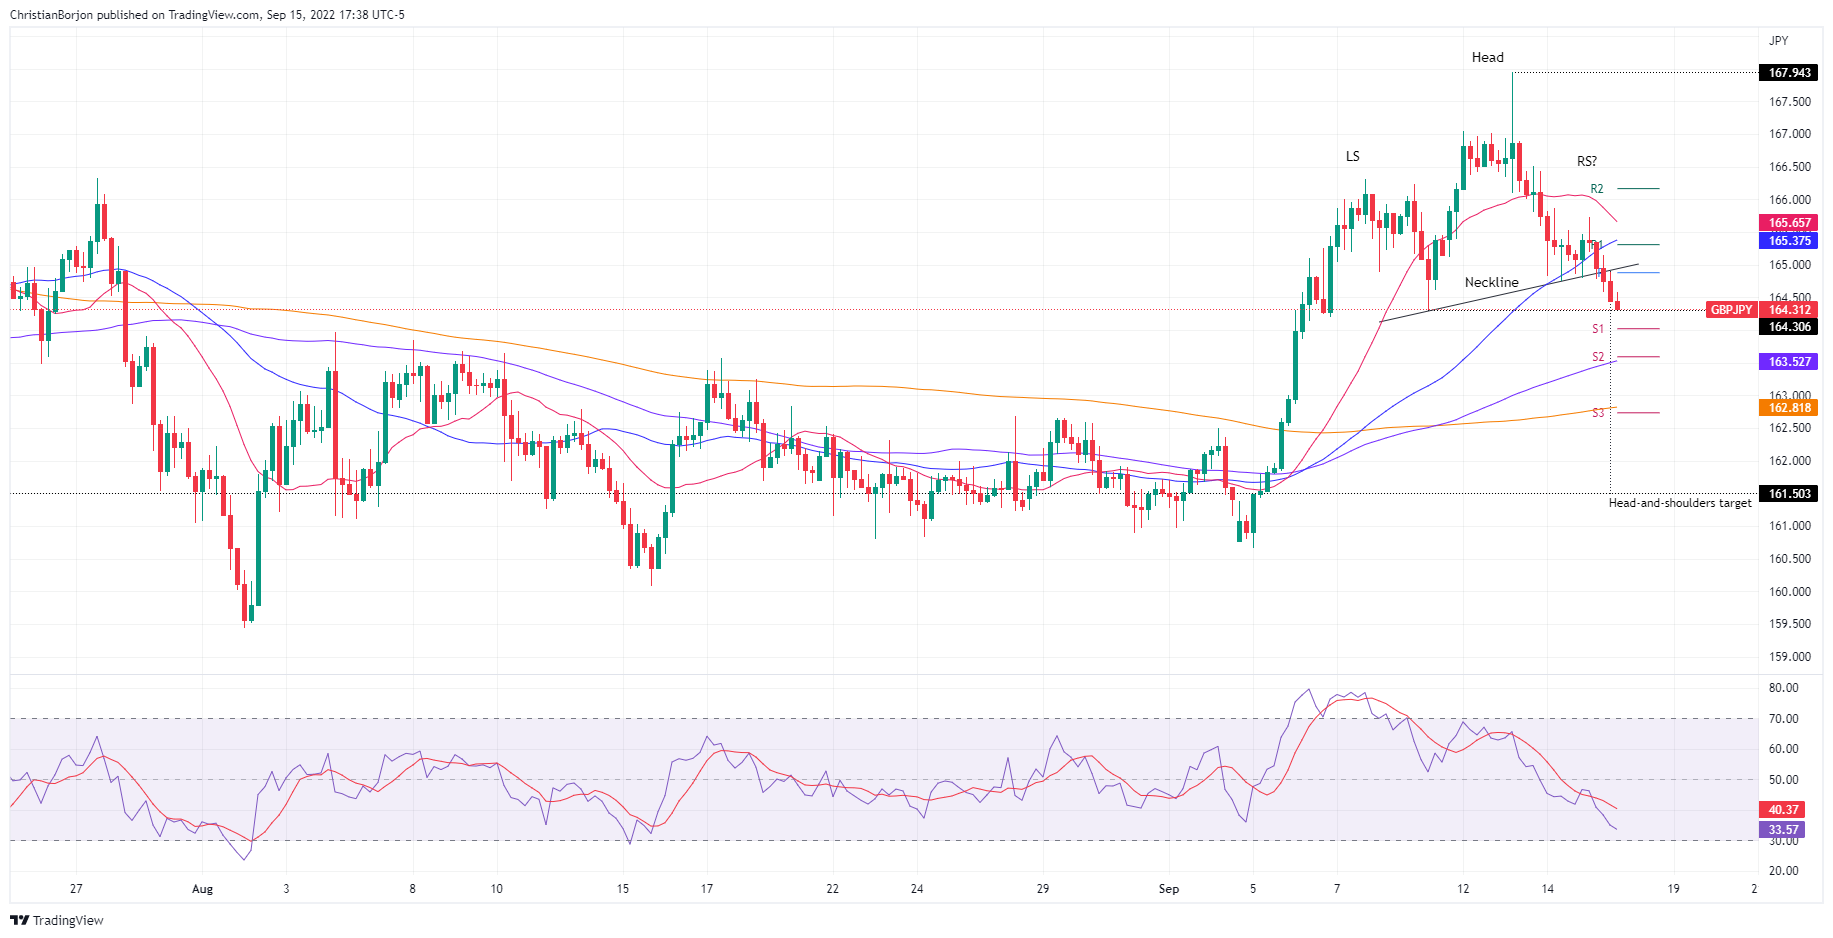
- The GBP/JPY 4-hour chart portrayed the formation of a head-and-shoulders pattern which targets a drop to 161.50.

On Thursday, the GBP/JPY extended its losses for the third consecutive trading day, courtesy of a risk-off impulse that kept investors leaning toward less risky assets, turning to the greenback alongside US Treasuries. Meanwhile, US equities finished with losses between 0.66% and 1.71%. At the time of writing, the GBP/JPY is trading at 164.31, below its opening price by 0.08%.
GBP/JPY Price Analysis: Technical outlook
During the week, the GBP/JPY hit a weekly high at around 167.94 before retreating due to some factors. Rumors of Japanese authorities intervening in the Forex Markets caused a Japanese yen repricing across most crosses. Therefore, the GBP/JPY tumbled on sentiment, though it’s testing the September 9 cycle low at 164.30. If the latter gives way, the pair could drop towards a confluence area with the 20, 50, and 100-day EMAs, around 163.00-34.
The GBP/JPY 4-hour chart confirms the bearish bias in the near term. A head-and-shoulders chart pattern emerged, which, measured by the distance of the head-to-the-neckline, would target a drop from current spot prices toward 161.50. therefore, the GBP/JPY first support would be the S1 pivot at 164.01. A breach of the latter will expose the confluence of the S2 daily pivot and the 100-EMA at 163.52, ahead of the confluence of the 200-EMA and the S3 pivot at 162.82, ahead of the161-50 target.
GBP/JPY Key Technical Levels
Author

Christian Borjon Valencia
FXStreet
Markets analyst, news editor, and trading instructor with over 14 years of experience across FX, commodities, US equity indices, and global macro markets.


