• GBP/JPY exchanges hands around familiar levels, above 163.00.
  • From a long-term perspective, the cross is neutrally biased, waiting for a catalyst.
  • The GBP/JPY hourly chart is neutral-biased but tilted downwards with sellers gathering momentum, as shown by the RSI.

The GBP/JPY seesaws during the North American session amidst a dull trading day. Investors are bracing for the release of US inflation data, which would be scrutinized by them, aiming to predict the next move of the FOMC in the September meeting. At the time of writing, the GBP/JPY is trading at 163.15.

The market sentiment is downbeat. US equities are trading with losses, while in the FX space, safe-haven peers begin to recover some ground, except for the US dollar. The GBP/JPY is trading near its opening price, after bouncing from daily lows at 162.62, before hitting the daily high at 163.67. However, risk aversion weighed on the pound, so the cross dived.

GBP/JPY Price Analysis: Technical outlook

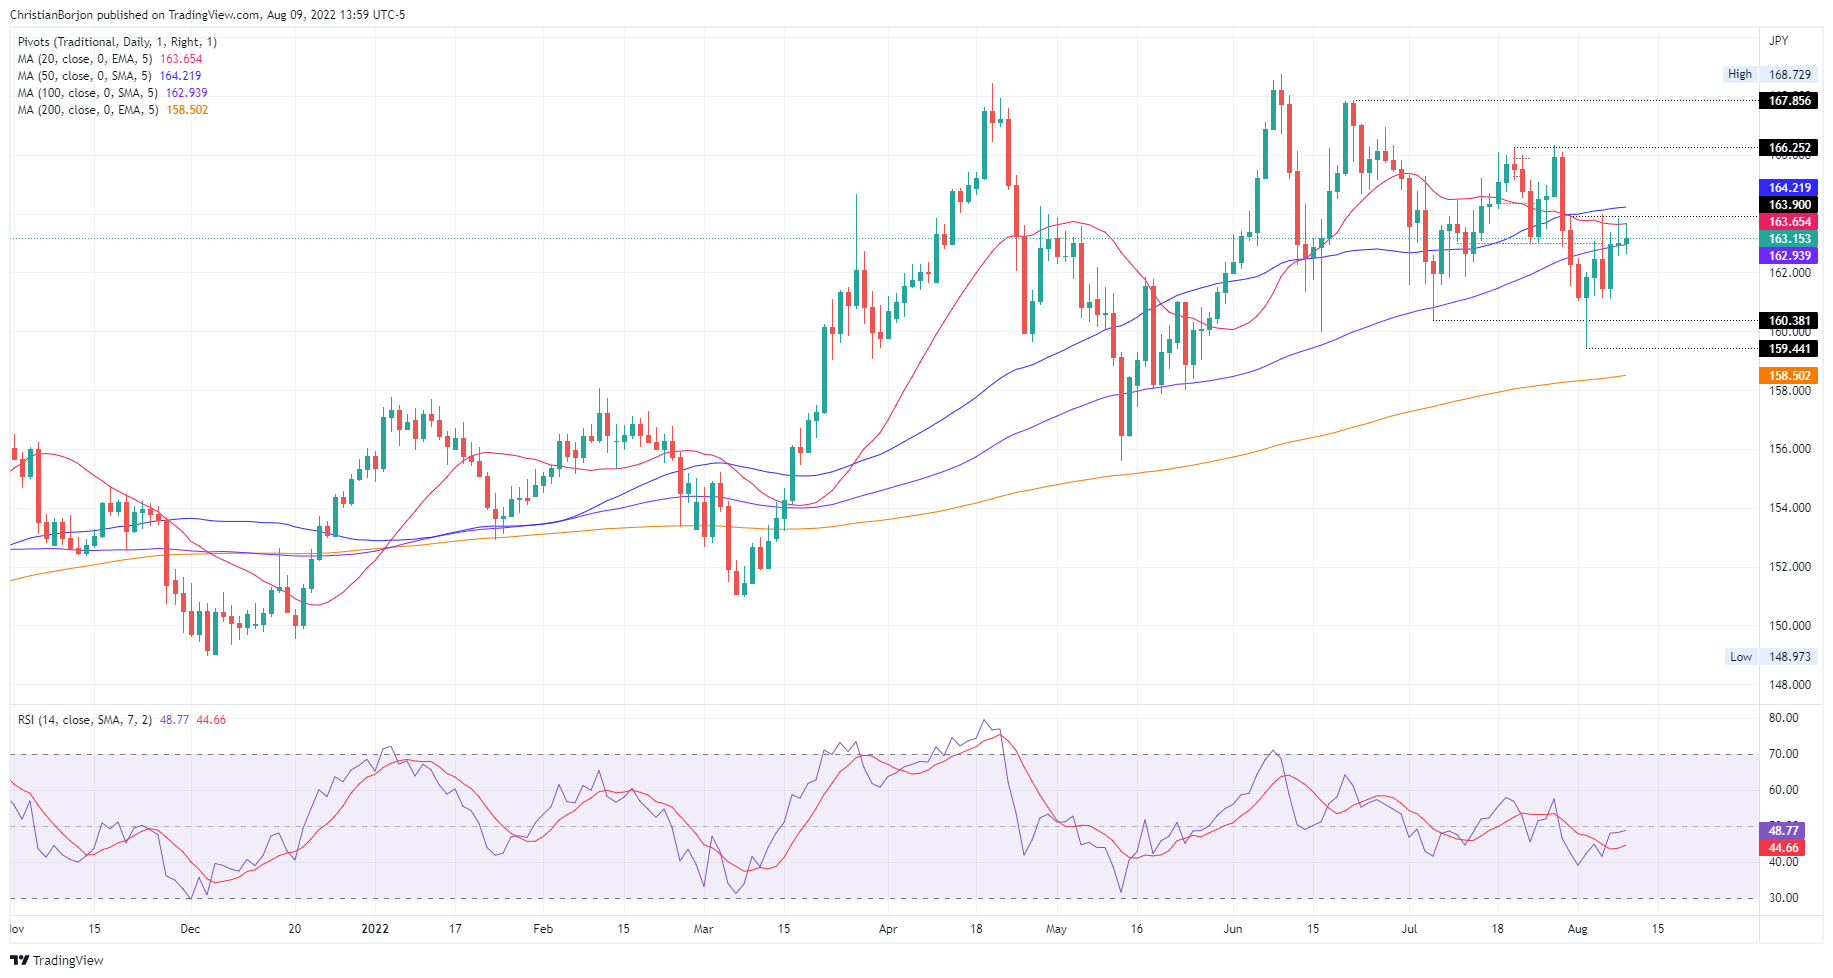
From a daily chart perspective, the GBP/JPY is neutral-biased. For the second straight day, buyers’ inability to breach the 20-day EMA at 136.64 increased selling pressure in the cross, with bears piling around the 163.60 area, pushing the exchange rate towards the 163.00 figure.

Hence, the GBP/JPY’s first support would be the August 8 low at 162.56. The break below will expose the August 5 low at 161.11, followed by the August 2 swing low at 159.44. Otherwise, if buyers reclaim the 20-day EMA at 163.64, that would open the door for a test of the 50-day EMA at 164.21.

GBP/JPY Daily chart

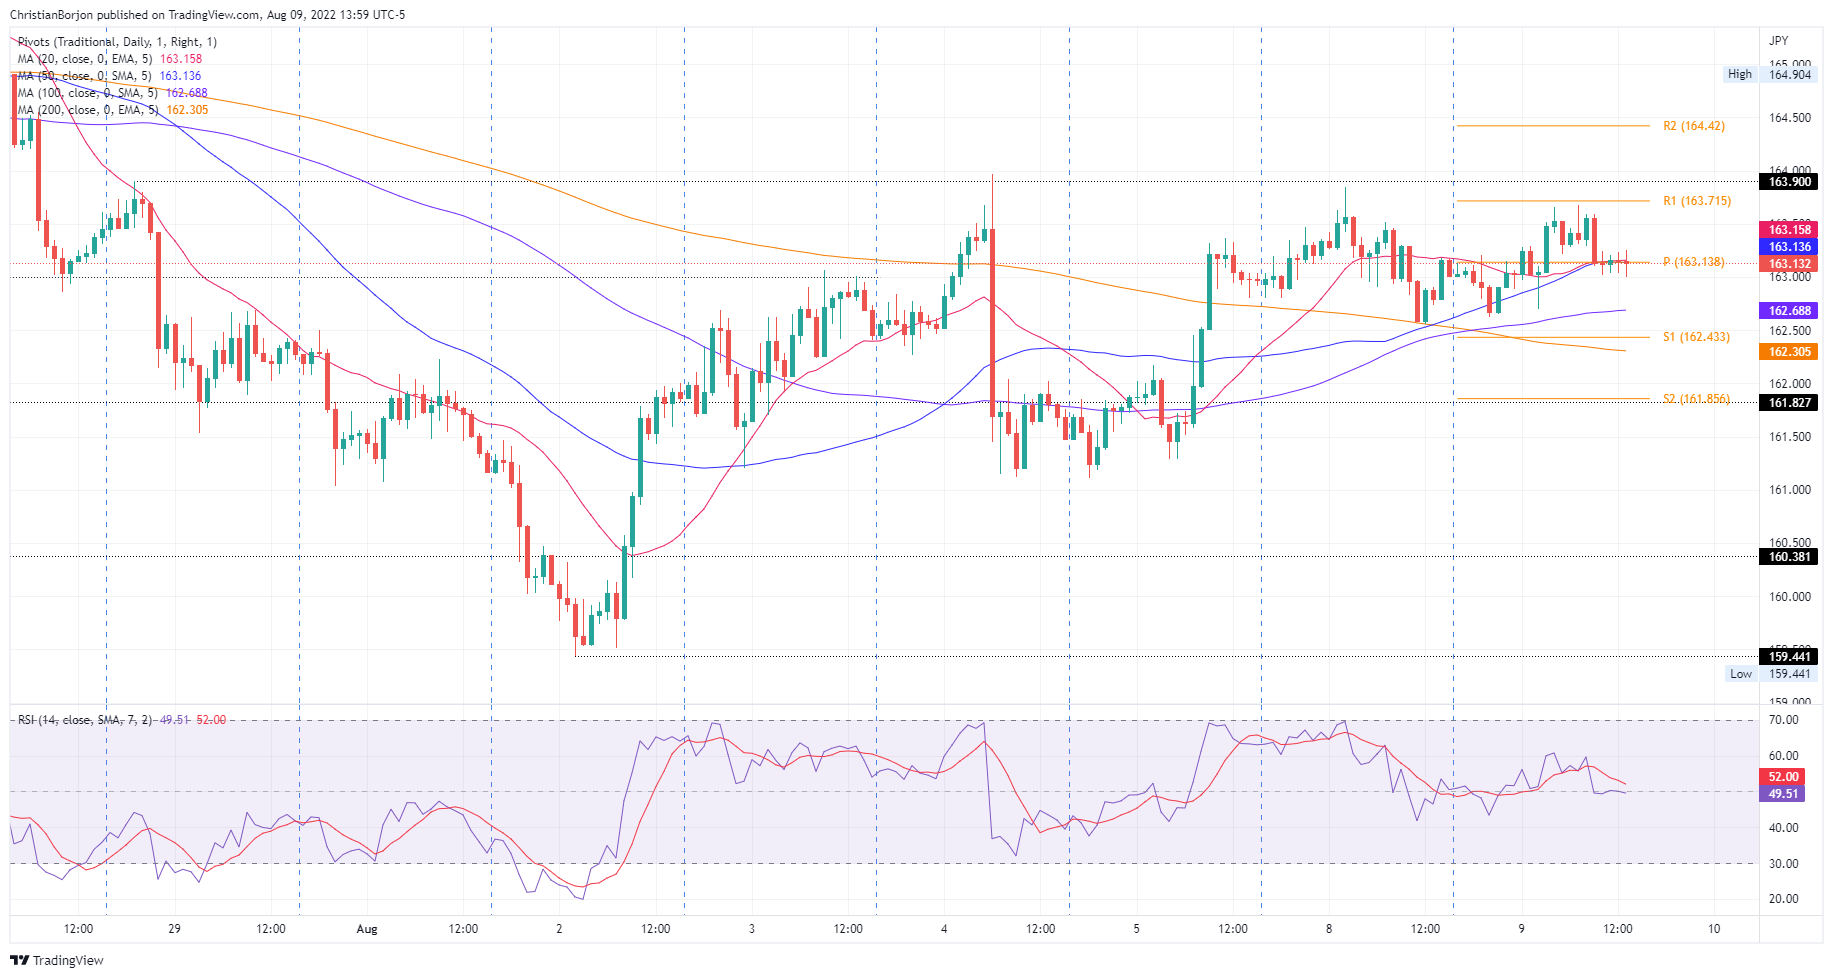
In the one-hour scale, the GBP/JPY is neutral biased, trapped within the 161.11-163.84 area. However, the Relative Strength Index (RSI) shows that sellers are gathering momentum, with the RSI at 47.26 and crossing below the 7-RSI SMA, meaning that bears are in control. Therefore, the GBP/JPY first support would be the 100-hour EMA at 162.68. Once cleared, the next support would be the S2 pivot point at 162.43, followed by the S1 daily pivot at 161.85. On the flip side, a break above 163.84 could send the pair towards the August 4 high at 163.97, which, once cleared, could open the door for further gains

GBP/JPY Hourly chart

GBP/JPY Key Technical Levels

GBP/JPY

Overview
Today last price 163.15
Today Daily Change -0.05
Today Daily Change % -0.03
Today daily open 163.08
 
Trends
Daily SMA20 163.68
Daily SMA50 164.27
Daily SMA100 162.98
Daily SMA200 158.52
 
Levels
Previous Daily High 163.85
Previous Daily Low 162.57
Previous Weekly High 163.99
Previous Weekly Low 159.45
Previous Monthly High 166.34
Previous Monthly Low 160.4
Daily Fibonacci 38.2% 163.36
Daily Fibonacci 61.8% 163.06
Daily Pivot Point S1 162.49
Daily Pivot Point S2 161.89
Daily Pivot Point S3 161.2
Daily Pivot Point R1 163.77
Daily Pivot Point R2 164.45
Daily Pivot Point R3 165.05


Share: Feed news

Information on these pages contains forward-looking statements that involve risks and uncertainties. Markets and instruments profiled on this page are for informational purposes only and should not in any way come across as a recommendation to buy or sell in these assets. You should do your own thorough research before making any investment decisions. FXStreet does not in any way guarantee that this information is free from mistakes, errors, or material misstatements. It also does not guarantee that this information is of a timely nature. Investing in Open Markets involves a great deal of risk, including the loss of all or a portion of your investment, as well as emotional distress. All risks, losses and costs associated with investing, including total loss of principal, are your responsibility. The views and opinions expressed in this article are those of the authors and do not necessarily reflect the official policy or position of FXStreet nor its advertisers. The author will not be held responsible for information that is found at the end of links posted on this page.

If not otherwise explicitly mentioned in the body of the article, at the time of writing, the author has no position in any stock mentioned in this article and no business relationship with any company mentioned. The author has not received compensation for writing this article, other than from FXStreet.

FXStreet and the author do not provide personalized recommendations. The author makes no representations as to the accuracy, completeness, or suitability of this information. FXStreet and the author will not be liable for any errors, omissions or any losses, injuries or damages arising from this information and its display or use. Errors and omissions excepted.

The author and FXStreet are not registered investment advisors and nothing in this article is intended to be investment advice.

Recommended content


Recommended content

Editors’ Picks

EUR/USD edges lower toward 1.0700 post-US PCE

EUR/USD edges lower toward 1.0700 post-US PCE

EUR/USD stays under modest bearish pressure but manages to hold above 1.0700 in the American session on Friday. The US Dollar (USD) gathers strength against its rivals after the stronger-than-forecast PCE inflation data, not allowing the pair to gain traction.

EUR/USD News

GBP/USD retreats to 1.2500 on renewed USD strength

GBP/USD retreats to 1.2500 on renewed USD strength

GBP/USD lost its traction and turned negative on the day near 1.2500. Following the stronger-than-expected PCE inflation readings from the US, the USD stays resilient and makes it difficult for the pair to gather recovery momentum.

GBP/USD News

Gold struggles to hold above $2,350 following US inflation

Gold struggles to hold above $2,350 following US inflation

Gold turned south and declined toward $2,340, erasing a large portion of its daily gains, as the USD benefited from PCE inflation data. The benchmark 10-year US yield, however, stays in negative territory and helps XAU/USD limit its losses. 

Gold News

Bitcoin Weekly Forecast: BTC’s next breakout could propel it to $80,000 Premium

Bitcoin Weekly Forecast: BTC’s next breakout could propel it to $80,000

Bitcoin’s recent price consolidation could be nearing its end as technical indicators and on-chain metrics suggest a potential upward breakout. However, this move would not be straightforward and could punish impatient investors. 

Read more

Week ahead – Hawkish risk as Fed and NFP on tap, Eurozone data eyed too

Week ahead – Hawkish risk as Fed and NFP on tap, Eurozone data eyed too

Fed meets on Wednesday as US inflation stays elevated. Will Friday’s jobs report bring relief or more angst for the markets? Eurozone flash GDP and CPI numbers in focus for the Euro.

Read more

Forex MAJORS

Cryptocurrencies

Signatures