|

GBP/JPY heading towards 186.00 as dovish BoJ continues to crush the Yen

  • The GBP/JPY is grinding towards 186.00 as Bank of Japan confirms dovish stance.
  • BoJ to continue massive bond purchases despite new operations.
  • GBP/JPY tips into a fresh 9-week high for Monday.

The GBP/JPY continues to climb with the Japanese Yen (JPY) continuing to get pushed into the floorboards by the Bank of Japan (BoJ) and its hyper-dovish policy stance.

BoJ Governor Ueda: Will continue massive bond buying even under new operation decided last week

BoJ Governor Kazuo Ueda confirmed early Monday that the Japanese central bank will continue with its hyper-easy monetary policy stance. Despite lifting the upper bound limit on their Yield Curve Control (YCC) mechanism, the BoJ reaffirmed their determination in buying as many Japanese government bonds as it needs to keep the yield curve tightly capped.

The BoJ also reaffirmed their fears that inflation and wage growth will slump below the central bank's target levels, and have dedicated to keep the doors on easy monetary policy as wide as they need to support the Japanese economy.

UK data this week: thin data spread, speaking notes from BoE Gov Bailey

It's a thin week on the economic calendar for the Pound Sterling (GBP), though S&P Global/CIPS Construction Purchasing Manager Index (PMI) for October came in above expectations, printing at 45.6 compared to the previous month's 45.0, beating the median market forecast of a decline to 44.5.

UK BRC Life-For-Like Retail Sales for the year into October will print early Tuesday, forecast to tick down from 2.8% to 2.4%, and Pound Sterling traders will be keeping an eye out for Bank of England (BoE) Governor Andrew Bailey who will be giving a speech at a conference on Wednesday.

GBP/JPY Technical Outlook

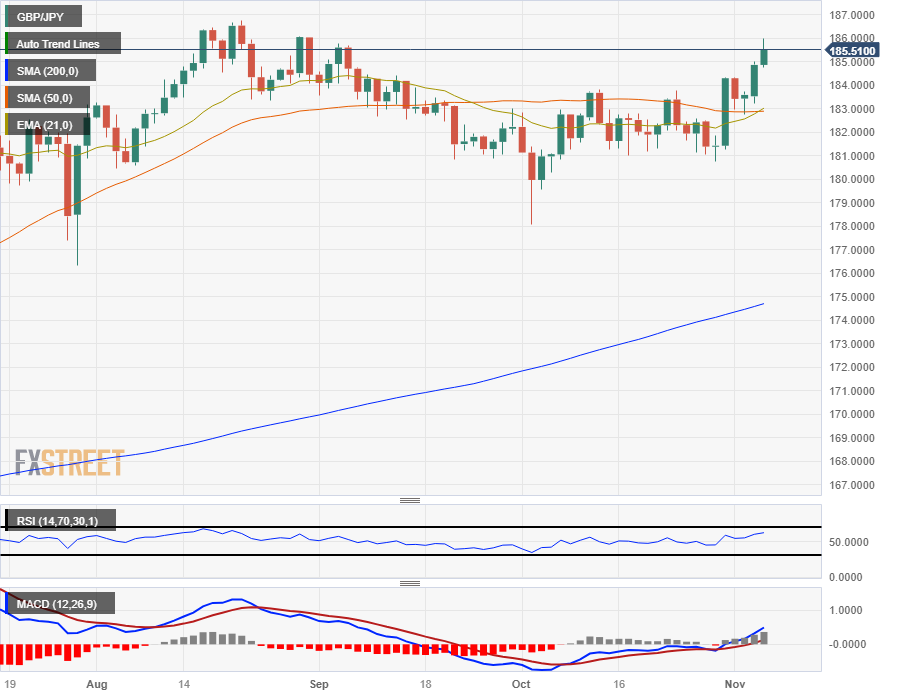
The GBP/JPY's push higher on Monday sets a new 9-week high for the pair, and the Guppy is set for a fresh challenge of the 186.00 handle.

The GBP has gained 2.6% against the Yen since last week's low near 180.75, and the pair is making a clean break higher after getting hung up near the 50-day Simple Moving Average (SMA) and the 21-day Exponential Moving Average (EMA), with the two moving averages braiding around the 183.00 level.

GBP/JPY Daily Chart
GBP/JPY Technical Levels

GBP/JPY

Overview
Today last price185.57
Today Daily Change0.71
Today Daily Change %0.38
Today daily open184.86
 
Trends
Daily SMA20182.62
Daily SMA50182.88
Daily SMA100182.77
Daily SMA200174.59
 
Levels
Previous Daily High185.02
Previous Daily Low183.23
Previous Weekly High185.02
Previous Weekly Low180.77
Previous Monthly High184.33
Previous Monthly Low178.08
Daily Fibonacci 38.2%184.34
Daily Fibonacci 61.8%183.91
Daily Pivot Point S1183.72
Daily Pivot Point S2182.58
Daily Pivot Point S3181.93
Daily Pivot Point R1185.51
Daily Pivot Point R2186.16
Daily Pivot Point R3187.3

Author

Joshua Gibson

Joshua joins the FXStreet team as an Economics and Finance double major from Vancouver Island University with twelve years' experience as an independent trader focusing on technical analysis.


More from Joshua Gibson
Share:

Editor's Picks

AUD/USD renews two-month lows near 0.6950 after Australian CPI data

AUD/USD is renewing two-month lows near 0.6950 in the Asian session on Wednesday, as below-expectations August Australian underlying CPI data pours cold water on expectations for further RBA interest rate hikes. Chinese PMI data also fail to inspire the Australian Dollar, despite a pause in the US Dollar advance.

USD/JPY drops below 157.00 as intervention risks counter Japan's weak data

USD/JPY keeps losses below 157.00 in the Asian session on Wednesday, as hawkish BoJ expectations, along with intervention risks, underpin the Japanese Yen, countering dismal domestic factory output and retail sales data. Meanwhile, a broad US Dollar retreat also collaborates to the pair's downside.

Gold consolidates below $4,200, looks to US ADP and PCE

Gold struggles to capitalize on the previous day's recovery from an eight-week low, consolidating below $4,200 in the Asian session on Wednesday. The overnight slide in oil prices eased the US Treasury bond rout, supporting the bullion. However, Fed rate-hike bets and inflationary concerns keep bond yields near multi-year highs. Moreover, geopolitical uncertainties underpin the safe-haven US Dollar, which, in turn, limits bullion.

Ethereum sees profit-taking near $2,700 ahead of key US economic data
Ethereum (ETH) has shown signs of profit-taking near $2,700 over the past few days, with rising exchange deposits and a slowdown in exchange-traded fund (ETF) inflows ahead of US inflation and labor market data releases. The top altcoin's Exchange Reserves, which track the total amount of a crypto asset held across exchange wallets, have increased by roughly 125K ETH since Friday.
Silver is more volatile than Gold ahead of PCE and NFP. This chart shows the positioning gap
The market’s attention is focused on American data this week, but there’s something only those with a trained eye may be looking at: Gold and Silver positioning gap. Financial markets are moving on fears, mostly related to persistently high energy prices driven by the Middle East war. Sure, the US Dollar (USD) is strong, but at what cost?
Silver is more volatile than Gold ahead of PCE and NFP. This chart shows the positioning gap
The market’s attention is focused on American data this week, but there’s something only those with a trained eye may be looking at: Gold and Silver positioning gap. Financial markets are moving on fears, mostly related to persistently high energy prices driven by the Middle East war. Sure, the US Dollar (USD) is strong, but at what cost?