|

GBP/CAD Price Forecast: Nearing upper channel line, bearish divergence

  • GBP/CAD is closing in on the upper channel line of a rising channel. 
  • It is likely to meet firm resistance at the line and price is diverging bearishly with MACD.

GBP/CAD is trending higher in a rising channel, however, it is close to touching the upper trendline of the channel where it is likely to meet firm resistance and will probably pull back down as a consequence. 

GBP/CAD Daily Chart 

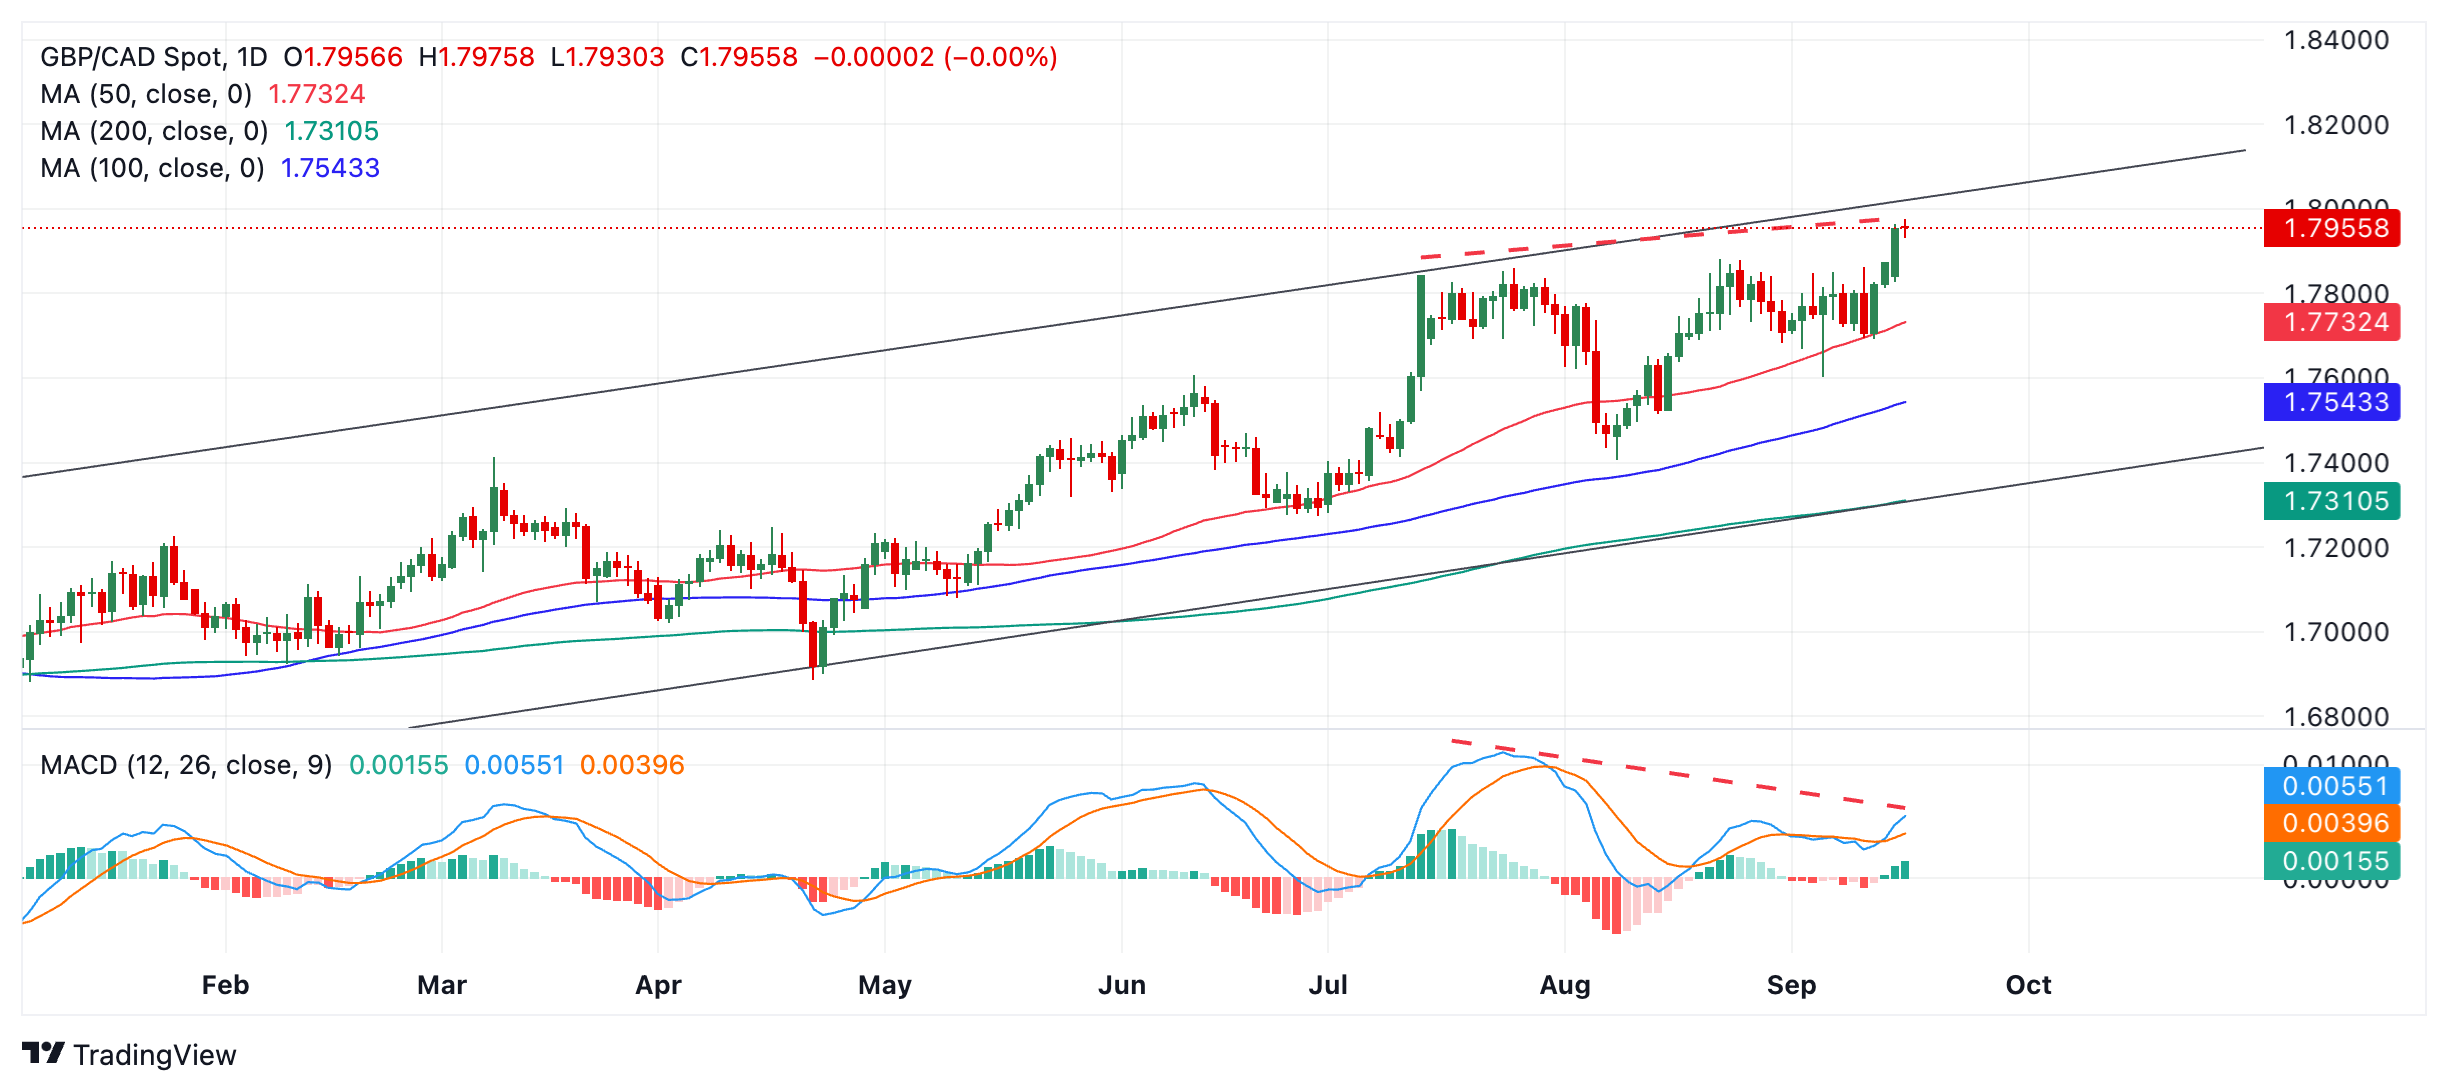
GBP/CAD is showing bearish divergence with the Moving Average Convergence Divergence (MACD) momentum indicator (red dashed lines). This means that although price has risen to a higher high compared to the July 12 high, MACD is actually lower than where it was on July 12. This is a bearish sign and suggests a higher chance of a pull back evolving. 

Taken together with the looming overhead channel line it indicates a risk of price correcting back down within the channel. An initial target for a pull back would be the 50-day Simple Moving Average (SMA) at 1.7733. 

Price itself has not formed a reversal pattern yet. If it does form a candlestick reversal pattern such as a Shooting Star, Bearish Engulfing or Hanging Man, for example, then that will be even more evidence of a correction unfolding.

Author

Joaquin Monfort

Joaquin Monfort is a financial writer and analyst with over 10 years experience writing about financial markets and alt data. He holds a degree in Anthropology from London University and a Diploma in Technical analysis.

More from Joaquin Monfort
Share:

Markets move fast. We move first.

Orange Juice Newsletter brings you expert driven insights - not headlines. Every day on your inbox.

By subscribing you agree to our Terms and conditions.

Editor's Picks

EUR/USD: Bulls pray for a dovish Fed

EUR/USD has finally taken a breather after a pretty energetic climb. The pair broke above 1.1680 in the second half of the week, reaching its highest levels in around two months before running into some selling pressure. Even so, it has gained almost two cents from the late-November dip just below 1.1500 the figure.

GBP/USD trims gains, recedes toward 1.3320

GBP/USD is struggling to keep its daily advance, coming under fresh pressure and retreating to the 1.3320 zone following a mild bullish attempt in the Greenback. Even though US consumer sentiment surprised to the upside, the US Dollar isn’t getting much love, as traders are far more interested in what the Fed will say next week.

Gold: Bullish momentum fades despite broad USD weakness

After rising more than 3.5% in the previous week, Gold has entered a consolidation phase and fluctuated at around $4,200. The Federal Reserve’s interest rate decision and revised Summary of Economic Projections, also known as the dot plot, could trigger the next directional move in XAU/USD. 

Week ahead: Rate cut or market shock? The Fed decides

Fed rate cut widely expected; dot plot and overall meeting rhetoric also matter. Risk appetite is supported by Fed rate cut expectations; cryptos show signs of life. RBA, BoC and SNB also meet; chances of surprises are relatively low. Dollar weakness could linger; both the aussie and the yen best positioned to gain further. Gold and oil eye Ukraine-Russia developments; a peace deal remains elusive.

Week ahead – Rate cut or market shock? The Fed decides

Fed rate cut widely expected; dot plot and overall meeting rhetoric also matter. Risk appetite is supported by Fed rate cut expectations; cryptos show signs of life. RBA, BoC and SNB also meet; chances of surprises are relatively low.

Ripple faces persistent bear risks, shrugging off ETF inflows

Ripple is extending its decline for the second consecutive day, trading at $2.06 at the time of writing on Friday. Sentiment surrounding the cross-border remittance token continues to lag despite steady inflows into XRP spot ETFs.