Federal Reserve Meeting Preview: All eyes on dot plot, three scenarios to trade US Dollar
- The Federal Reserve is set to leave interest rates unchanged but signal its next moves via its dot plot.
- New forecasts for peak borrowing costs in 2023 and 2024 are set to trigger an instant reaction.
- Markets tend to reverse some moves after the dot plot is out.

Markets are always looking to the future – and the Federal Reserve’s (Fed) dot plot is something investors can cling to foresee its next moves. In addition, the Fed’s figures can be read by algorithms, triggering a response that is fast and furious. For retail traders who fear missing out, the counter-reaction to this initial response to the dots provides a trading opportunity.
Here is a preview of the Fed decision and the dot plot, due out on Wednesday at 18:00 GMT.
Federal Reserve Chair Jerome Powell and his colleagues prefer pre-announcing the rate decision. Senior officials signalled an upcoming pause in the interest-rate hiking cycle, the first breather the bank takes in over a year. Nevertheless, several members of the Federal Open Markets Committee (FOMC) have stressed that this may merely be a “skip” decision – leaving rates unchanged now only to resume raising them in July.
How will markets quickly assess what lies ahead? That is where the dot plot comes in handy. Every three months, the Fed publishes a Summary of Economic Projections. Initially, this document only consisted of a chart plotting the projections of various Fed members, each represented by a dot – hence the name: dot plot.
What the Federal Reserve dot plot looks like:
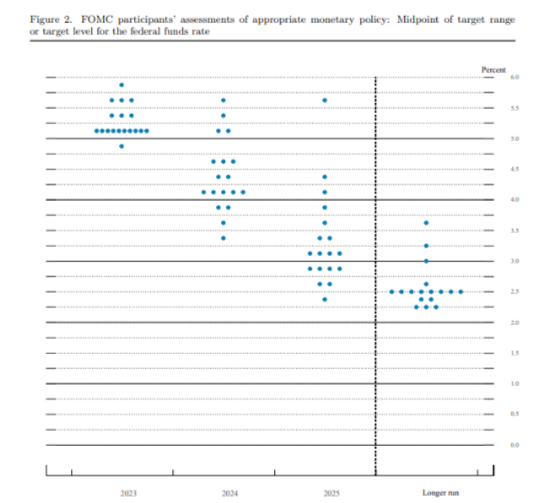
Source: Federal Reserve
The bank later added a handy table summarizing the range of forecasts and, most importantly, the median. The Fed releases forecasts for economic growth, the unemployment rate, and inflation as reflected in the Personal Consumption Expenditure (PCE) gauge as well as the Core PCE measure, and the cherry on the cake – the interest rate.
These dot plot documents are released only once every other meeting, giving them more impact. In March, the Fed left its end-2023 interest rate median projection at 5.1% but raised the forecast for end-2024 to 4.3% from 4.1%, in a sign that policymakers expected rates to remain higher for longer.
How the dot plot looks in its table format. The numbers at the bottom left are what matter most: the updated projection for the interest rate at the end of this year and the next:
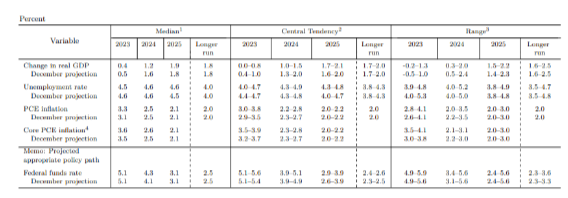
Source: Federal Reserve
The current Federal Funds rate is at a range of 5.00-5.25%, at what the Fed projected for year-end. Officials insisted that no rate cuts are planned for 2023. Markets initially priced looser monetary policy for later in the year but reluctantly aligned to the Fed’s view after several hawkish comments from officials.
Bond markets expect rates to end the year at current levels after potentially rising in July. Nevertheless, uncertainty is sky-high, and that means high volatility.
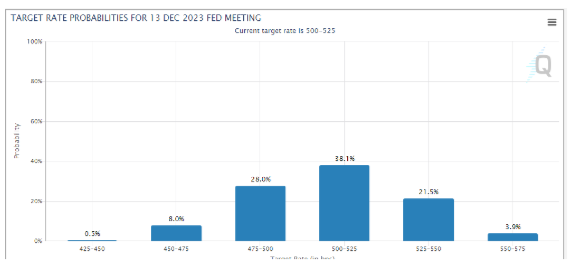
Source: CME Group
How to trade the Fed dot plot – three scenarios
The Fed would likely want to leave the door open to a rate hike in July while continuing to refrain from rate cuts this year. This view implies a bump in the dot plot, resulting in an interest rate median forecast of 5.3% or 5.4% at the end of 2023.
I see such a scenario as the most probable one, resulting in a knee-jerk reaction favouring the US Dollar and sinking stocks. But, as mentioned earlier, the moves may quickly reverse in anticipation of Fed Chair Powell’s press conference 30 minutes after the release.
And for a good reason – Powell may smooth out any hawkish perception by reiterating the bank is data-dependent. Signs of a slowdown in the US economy may continue accumulating between the Fed’s meetings.
In this mainstream scenario, the dot plot would provide an opportunity to go against the US Dollar.
The second scenario is a hawkish outcome – the dot plot showing the Fed raising its forecast to 5.5% by the end of 2023. Such an outcome would spook markets, sending the Greenback higher.
A reversal will only come if Powell contrasts or substantially softens the message afterwards. Investors are unlikely to send the US Dollar down before hearing from Powell.
The third scenario, a highly unlikely dovish outcome, is for the dot plot to remain unchanged for 2023. If the Fed refuses to indicate net higher borrowing costs by year-end, the US Dollar will plunge. Similar to the expected behaviour in response to the hawkish outcome, there is room for reversal only when Powell talks.
He could say that if inflation rises, the Fed could still raise rates. Nevertheless, I do not expect an instant correction but for markets to move only upon confirmation from the Fed Chair.
Final thoughts
The Federal Reserve’s dot plot is critical to the market’s instant reaction – and the counter-trend. I suggest trading carefully as markets tend to move choppily around the event.
Natural Gas FAQs
What fundamental factors drive the price of Natural Gas?
Supply and demand dynamics are a key factor influencing Natural Gas prices, and are themselves influenced by global economic growth, industrial activity, population growth, production levels, and inventories. The weather impacts Natural Gas prices because more Gas is used during cold winters and hot summers for heating and cooling. Competition from other energy sources impacts prices as consumers may switch to cheaper sources. Geopolitical events are factors as exemplified by the war in Ukraine. Government policies relating to extraction, transportation, and environmental issues also impact prices.
What are the main macroeconomic releases that impact on Natural Gas Prices?
The main economic release influencing Natural Gas prices is the weekly inventory bulletin from the Energy Information Administration (EIA), a US government agency that produces US gas market data. The EIA Gas bulletin usually comes out on Thursday at 14:30 GMT, a day after the EIA publishes its weekly Oil bulletin. Economic data from large consumers of Natural Gas can impact supply and demand, the largest of which include China, Germany and Japan. Natural Gas is primarily priced and traded in US Dollars, thus economic releases impacting the US Dollar are also factors.
How does the US Dollar influence Natural Gas prices?
The US Dollar is the world’s reserve currency and most commodities, including Natural Gas are priced and traded on international markets in US Dollars. As such, the value of the US Dollar is a factor in the price of Natural Gas, because if the Dollar strengthens it means less Dollars are required to buy the same volume of Gas (the price falls), and vice versa if USD strengthens.
Author

Yohay Elam
FXStreet
Yohay is in Forex since 2008 when he founded Forex Crunch, a blog crafted in his free time that turned into a fully-fledged currency website later sold to Finixio.


