|

EUR/USD - Treasury yield curve, US-German yield spread signal USD weakness, Is 1.20 on the cards?

Monthly 50-MA is a tough nut to crack - The EUR/USD spot clocked a high of 1.1893 yesterday, but failed for the second day to end the day above the monthly 50-MA level of 1.1871. The currency pair was seen chipping away the key MA hurdle in Asia amid caution ahead of the US non-farm payrolls and wage growth data release. 

The yield curve is flattest since late June
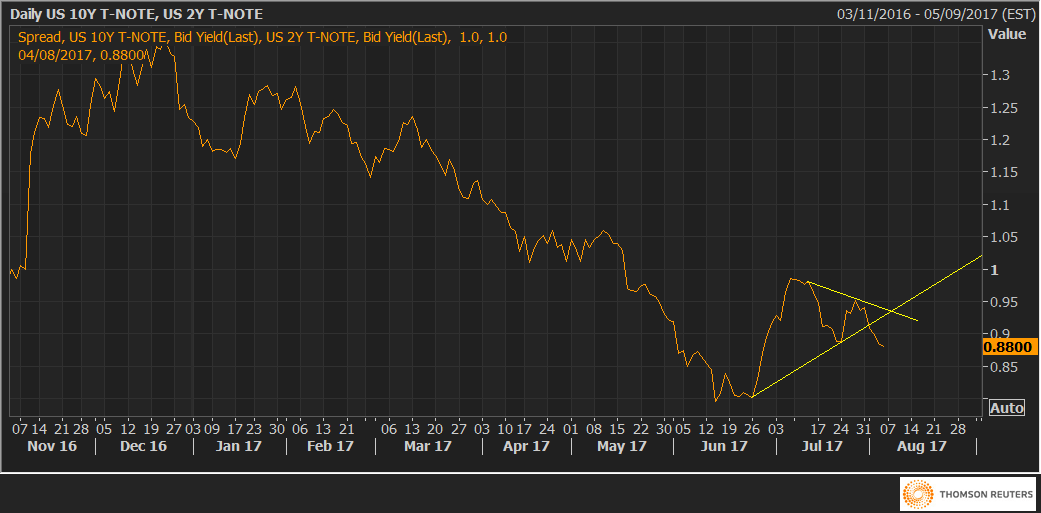
The US dollar loves a steeper yield curve and vice versa. As of now the curve between the 10-yr note and the two-year note stands at 88 basis points bps, the lowest level since June 28. On the chart above, we also see a bearish symmetrical triangle breakdown, which signals the flattening of the yield curve from the Dec high of 135 bps has resumed. 

US-German 10-yr yield spread - Falling channel intact
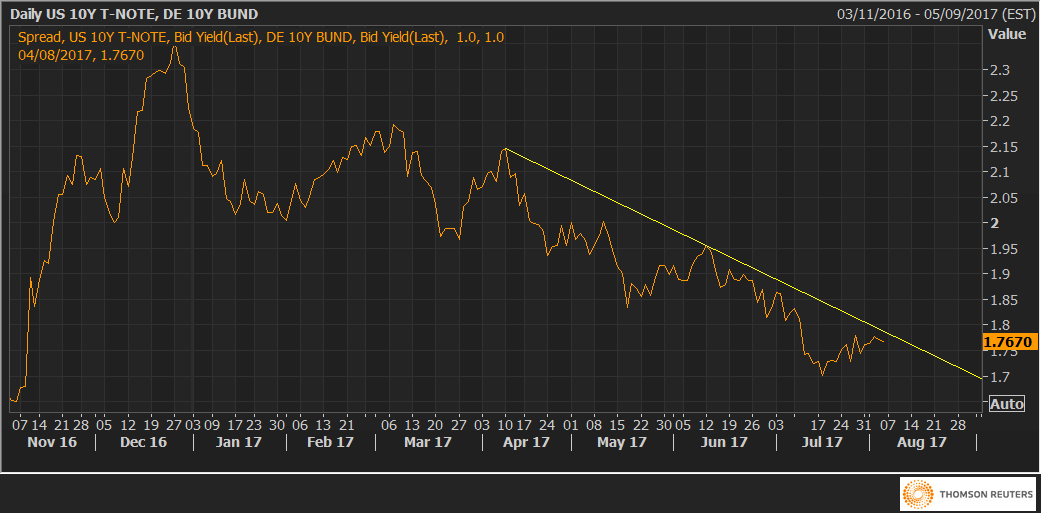
The descending trend line on the chart above indicates the yield spread could continue to narrow in favor of the EUR. Only a breach of trend line resistance would offer hope for the USD bulls. 

Focus on US wage growth

The yield curve would steepen and the US-German yield spread could jump, leading to a drop in the EUR/USD pair if the US wage growth number betters estimates. On the contrary, a weak data could lead to further flattening of the yield curve and a broad based USD sell-off, in which case the EUR/USD could inch closer to 1.20 handle. 

EUR/USD Technical Levels

A break above 1.1876 [June 2010 low] would open doors for a move above 1.19 [psychological level]. The 14-day RSI and the weekly RSI are extremely overbought. So gains above 1.19 handle may not be sustainable.  A big resistance is seen directly at 1.2042 [July 2012 low]. 

On the downside, support is seen at 1.1849 [5-DMA] and 1.1769 [10-DMA]. Both the averages are sloping upwards hence dips could be short lived. Only an end of the day close below 1.1723 [July 31 low] would indicate potential for a serious pullback in the pair.

 TREND INDEXOB/OS INDEXVOLATILY INDEX
15MBullishNeutral Shrinking
1HBullishNeutral Shrinking
4HBullishNeutral Low
1DBullishOverbought High
1WBullishOverbought High

Author

Omkar Godbole

Omkar Godbole

FXStreet Contributor

Omkar Godbole, editor and analyst, joined FXStreet after four years as a research analyst at several Indian brokerage companies.


More from Omkar Godbole
Share:

Editor's Picks

GBP/USD bounces off four-day lows, still below 1.3500

GBP/USD sticks to the bearish tone on Thursday, coming down to the 1.3480 region in the latter part of the NA session. In the meantime, Cable’s weakness comes as investors continue to assess mixed UK data, poor US results, and the persistent uncertainty surrounding the US-Iran conflict.

EUR/USD looks apathetic around 1.1530

EUR/USD reverses Wednesday’s downtick and trades with modest gains in the 1.1530 region following the end of the NA session on Thursday. The pair’s tepid advance comes on the back of the absence of clear direction in the US Dollar despite tensions from the Middle East appear far from alleviated. Later on Friday, investors are expected to monitor the the releases of another revision of GDP figures in the Euroland, US Retail Sales and the preliminary U-Mich gauge.

Gold remains on the defensive below $4,350; downside seems cushioned

Gold trades below $4,350 during the Asian session on Friday and looks to extend the previous day's pullback from the highest level since June 5 as the US-Iran standoff continues to underpin the US Dollar's reserve-currency status. However, reduced bets for an immediate Fed rate hike, amid signs of cooling US inflation, should act as a tailwind for the non-yielding bullion and help limit deeper losses.

Dogecoin reclaims $0.07 support as whales step in
Dogecoin (DOGE) edges above the daily open, trading above $0.070 as of Thursday. While this uptick offers a positive signal, DOGE continues to trade within a broader bearish context, down approximately 12% from its July peak of $0.079. Still, should the $0.070 support level hold, the mild recovery could gather pace, targeting resistance at $0.080 and potentially the key $0.100 threshold.
Why credit markets aren’t pricing $570B of AI debt

Forecasts put global artificial intelligence related debt issuance near $570 billion this year, with roughly $236 billion of it priced by the end of May at four times the prior year's pace. Data centre securitisation alone has gone from about $4 billion a year through 2022 to roughly $10 billion in each of 2023 and 2024, and then $27 billion in 2025.

Why is Crude Oil priced for a reopening the ships haven't made?
Fourteen vessels crossed the Strait of Hormuz on Tuesday. Before the war, the count ran near 120 a day. In the sessions since the waterway was publicly declared open, Brent has drifted back to $87 and West Texas Intermediate (WTI) to $81, both a little lower again on Wednesday, with daily momentum on each unwound from the top of its range in late July to the low twenties now.















