|
EUR/USD Technical Analysis: Slow bearish grind, trading sub-1.1024 level
- EUR/USD remains trapped in a very narrow range in the second part of the week.
- The level to beat for bears is the 1.0995 support level.

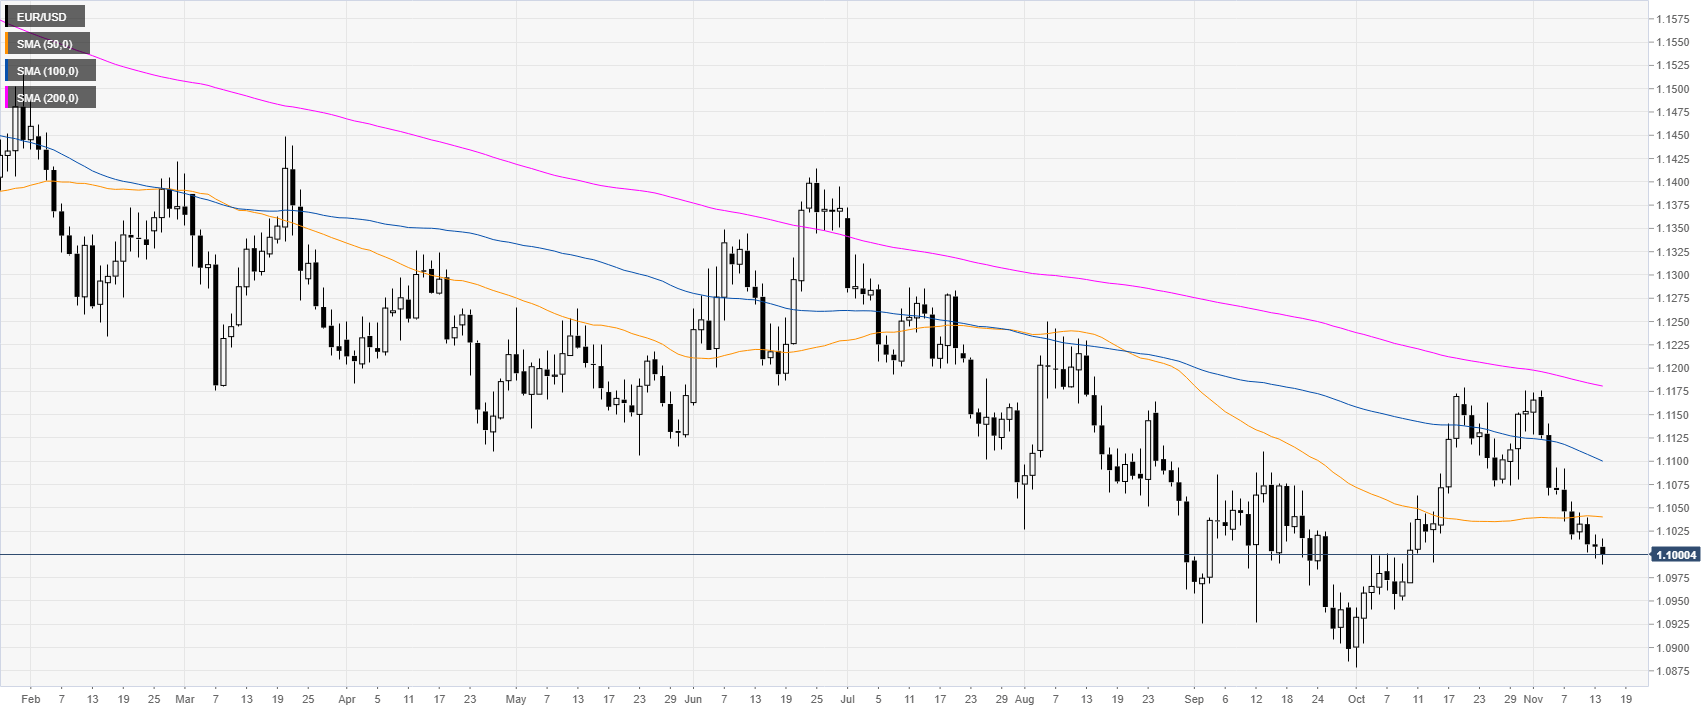
EUR/USD daily chart
The Fiber, on the daily chart, is trading in a bear trend below its main daily simple moving averages (DMAs). This Thursday, the market is remaining trapped in the range of the last 24 hours.
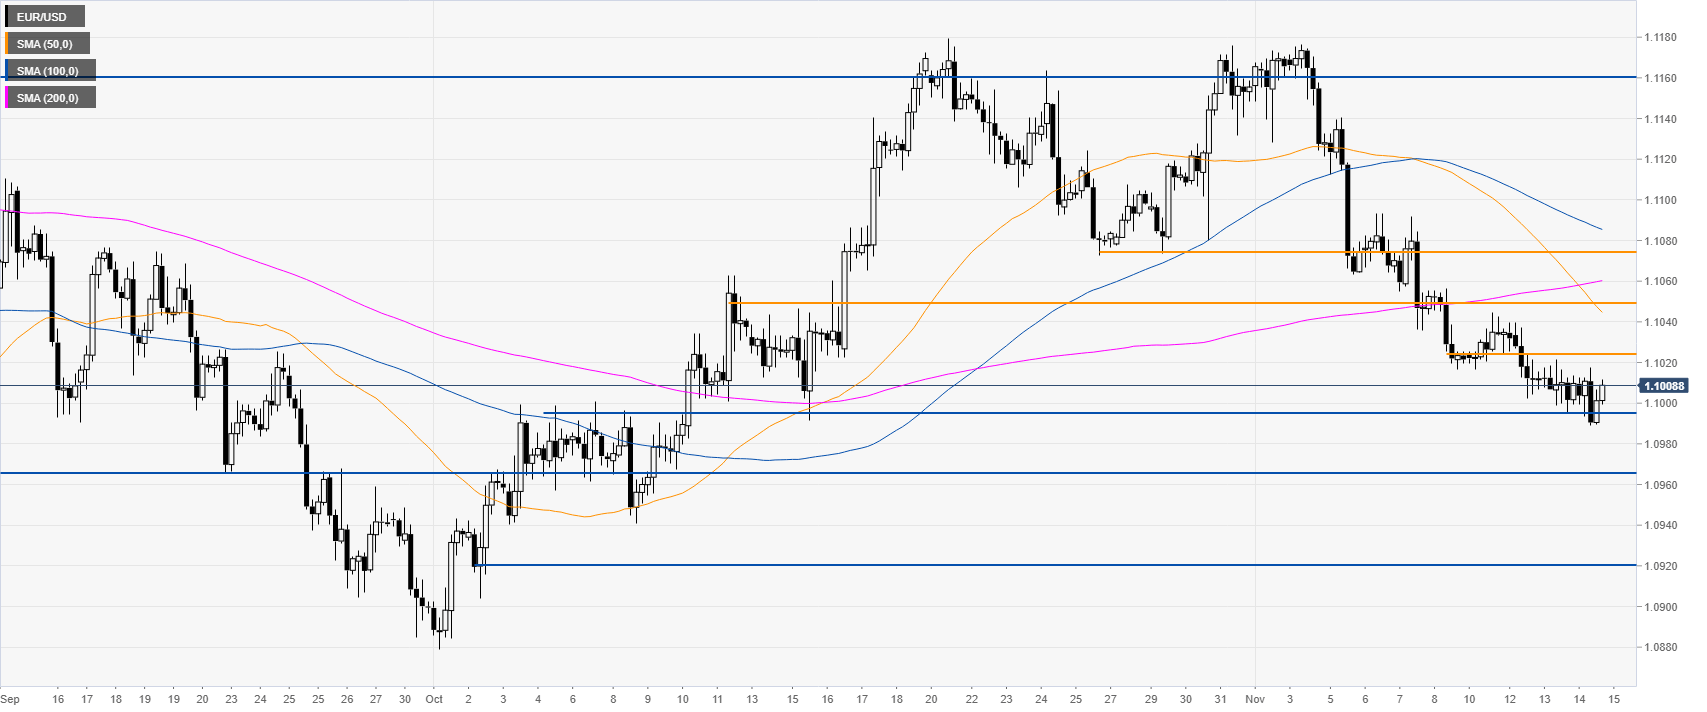
EUR/USD four-hour chart
The market remains under bearish pressure below the 1.1024 resistance level. The spot is likely set for an extension of the down move towards the 1.0995, 1.0966 and 1.0920 support levels, according to the Technical Confluences Indicator.
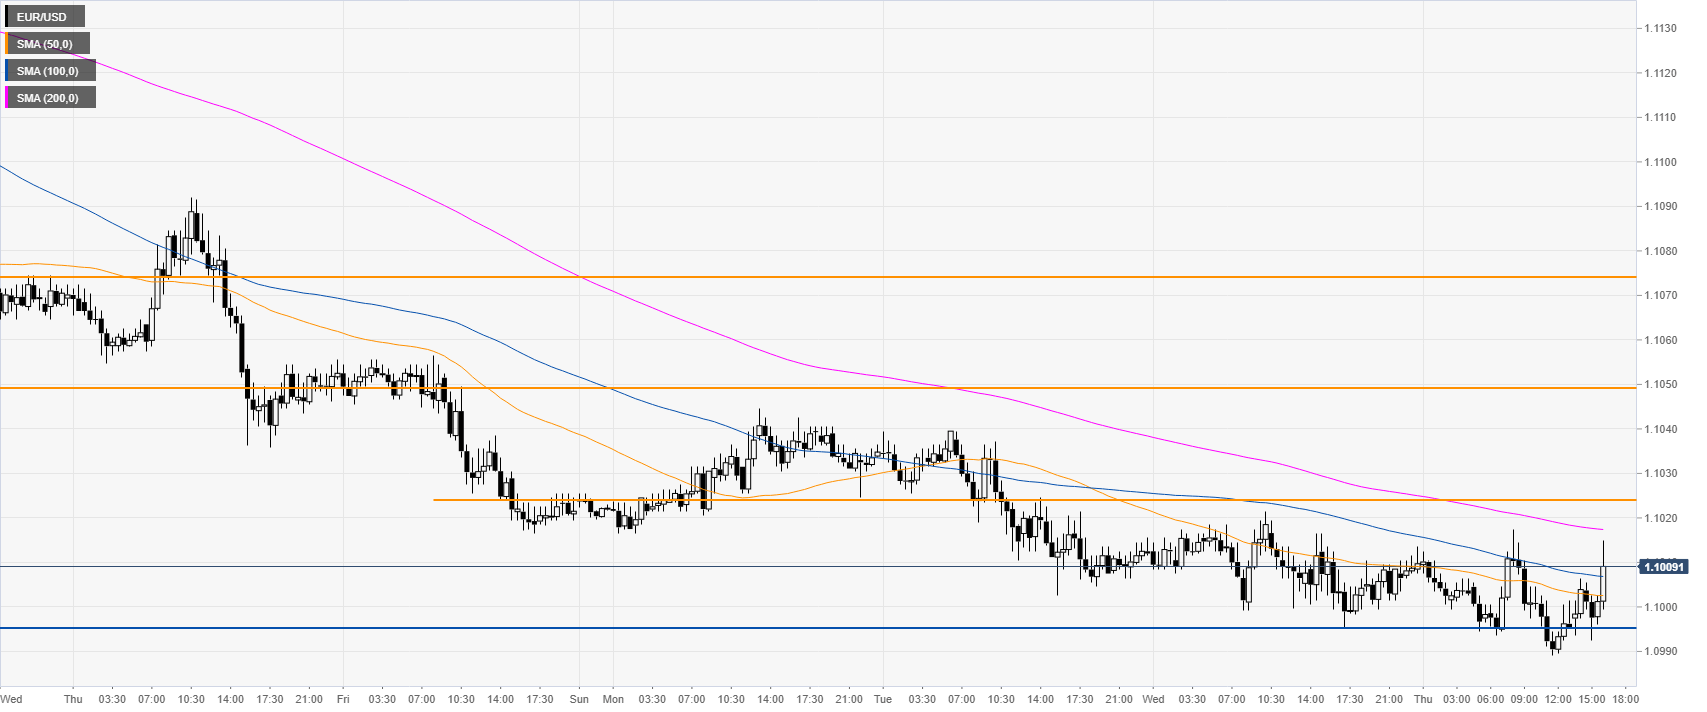
EUR/USD 30-minute chart
The Euro is under pressure below its falling 200 SMA. Resistance can be seen at the 1.1024, 1.1052 and 1.1075 price levels, according to the Technical Confluences Indicator.
Additional key levels
Author

Flavio Tosti
Independent Analyst
More from Flavio Tosti


