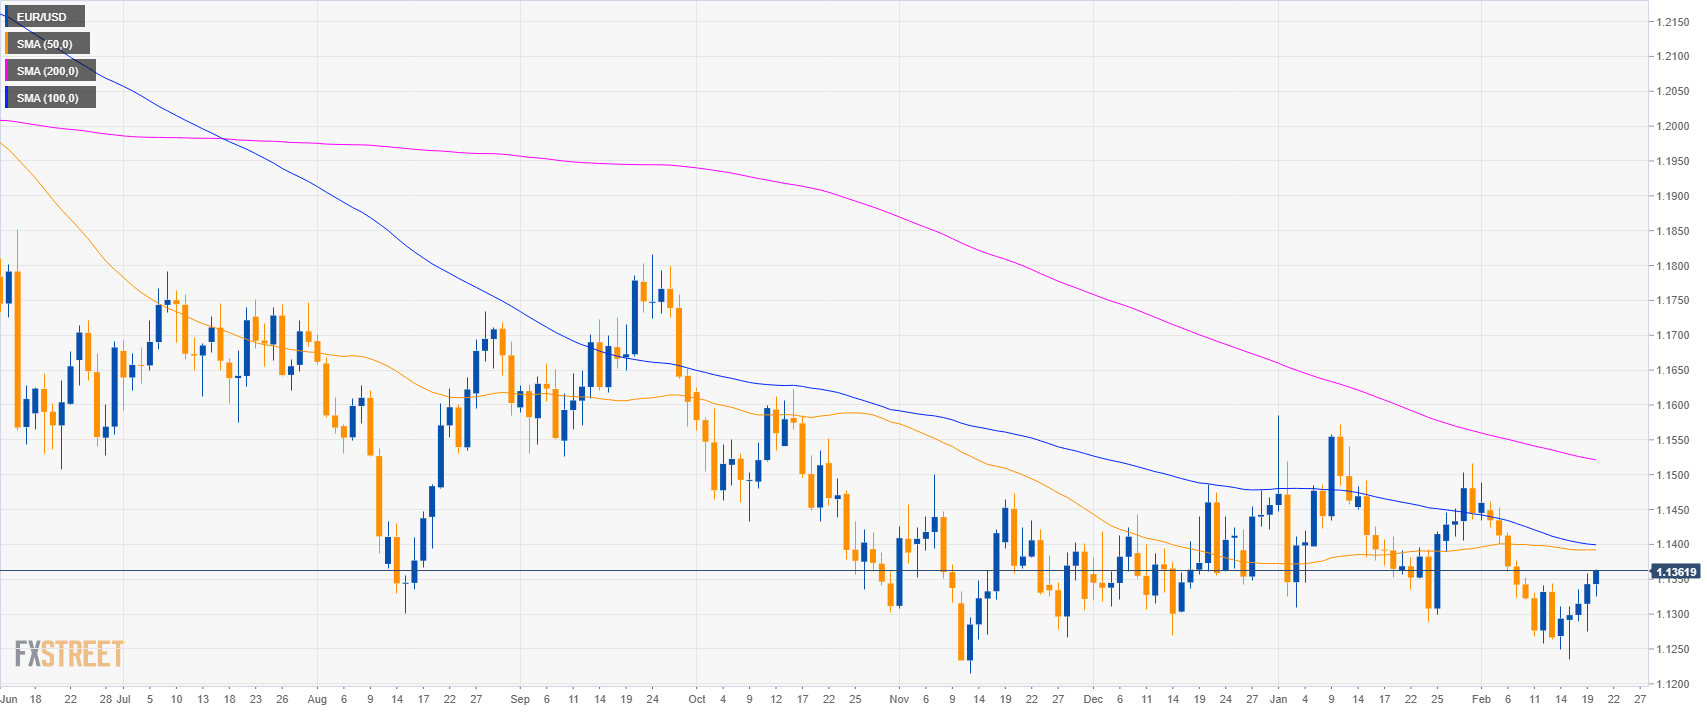
EUR/USD daily chart
- EUR/USD is evolving in a bear trend below the 200-day simple moving average (SMA).
- The FOMC Minutes at 19.00 GMT can potentially provide high volatility in the financial markets and in USD-related pairs.
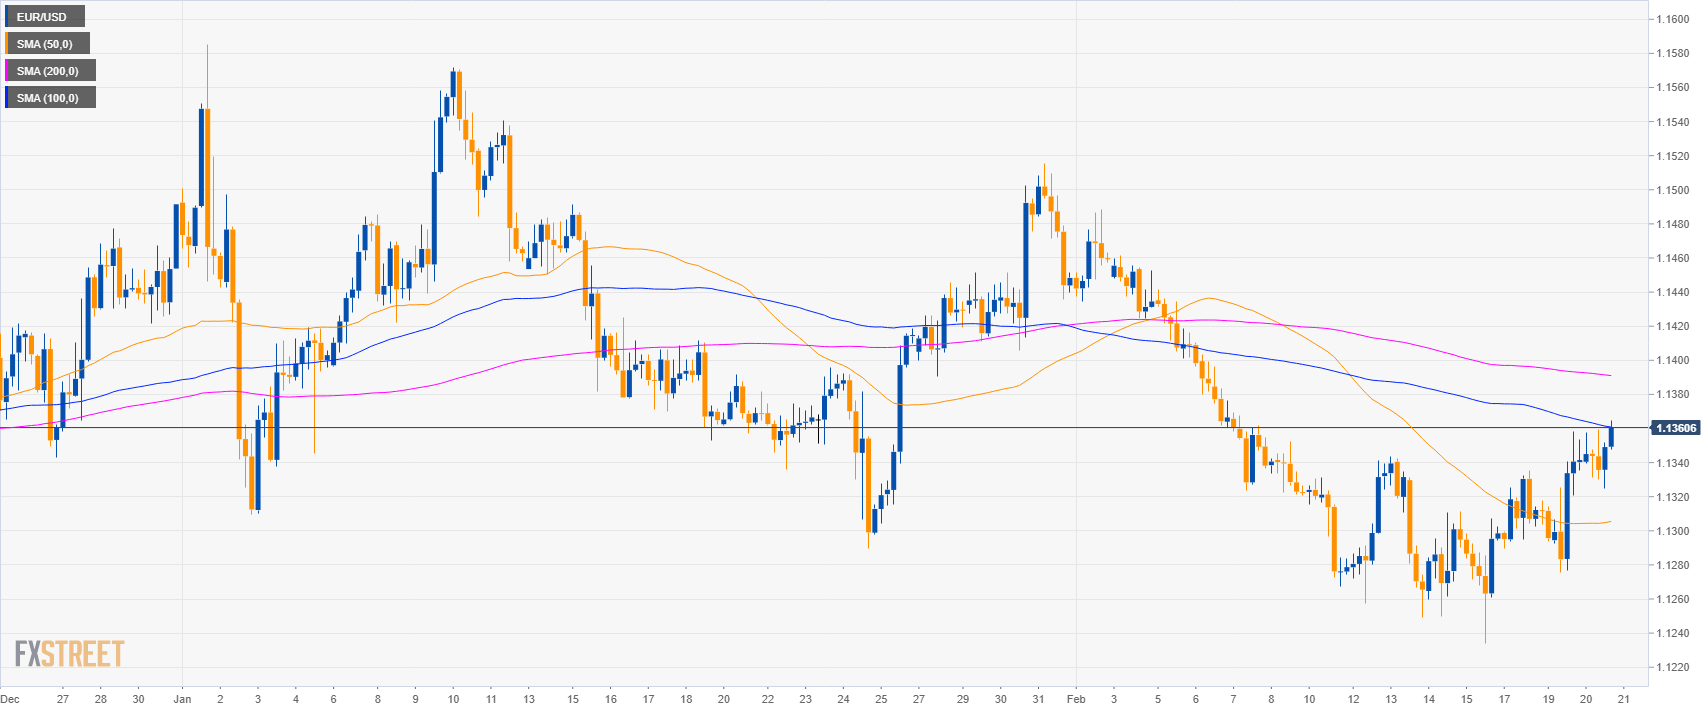
EUR/USD 4-hour chart
- EUR/USD bulls are challenging the 100 SMA.
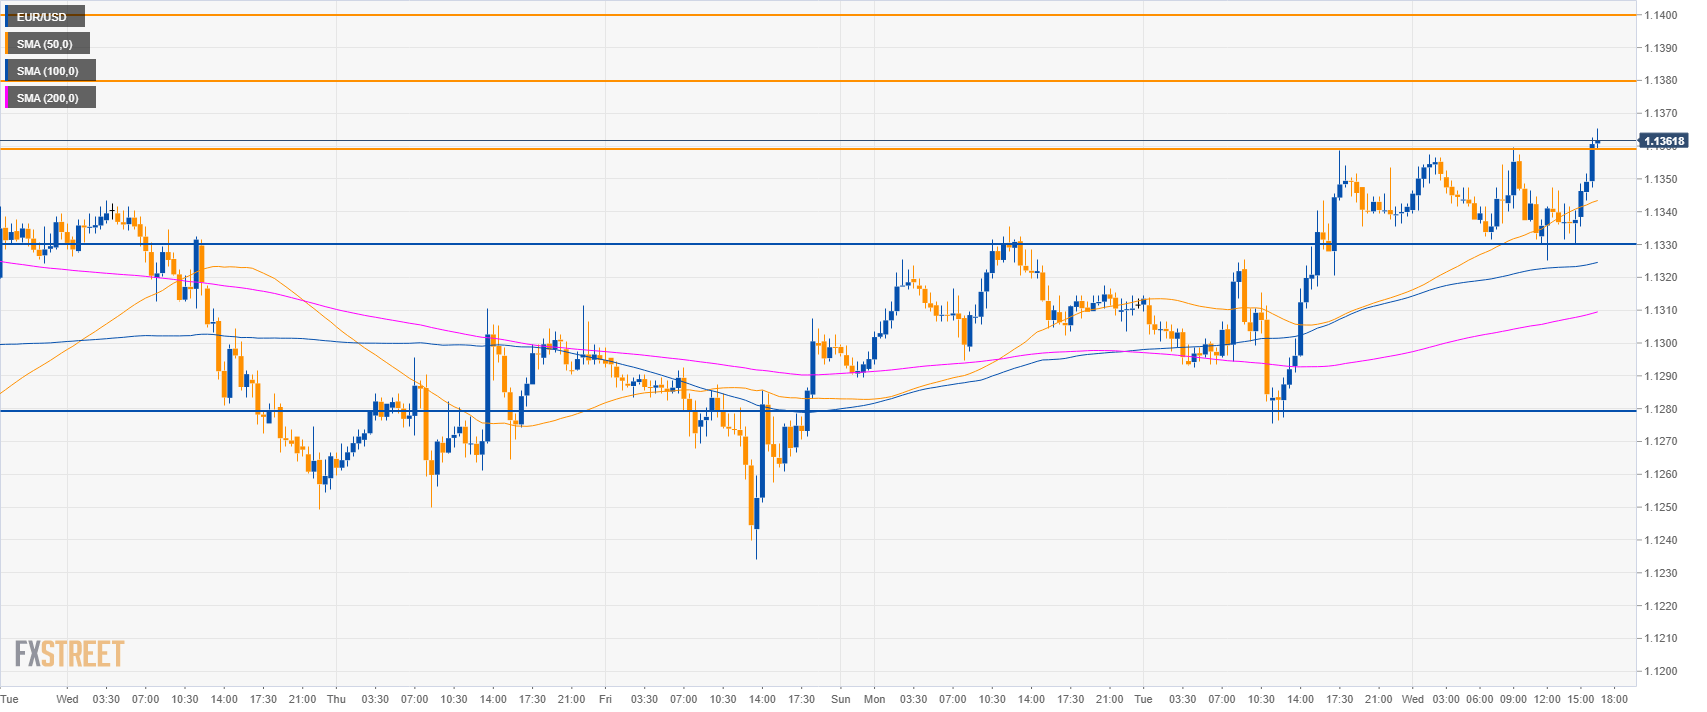
EUR/USD 30-minute chart
- EUR/USD is trading above the main SMAs suggesting bullish momentum in the short-term.
- A significant break above 1.1360 will most likely lead to 1.1380 and 1.1400 figure.
- To the downside, support is seen at 1.1330 and 1.1280 key level.
Additional key levels
EUR/USD
Overview:
Today Last Price: 1.136
Today Daily change: 17 pips
Today Daily change %: 0.15%
Today Daily Open: 1.1343
Trends:
Daily SMA20: 1.1368
Daily SMA50: 1.1392
Daily SMA100: 1.14
Daily SMA200: 1.1524
Levels:
Previous Daily High: 1.1358
Previous Daily Low: 1.1276
Previous Weekly High: 1.1344
Previous Weekly Low: 1.1234
Previous Monthly High: 1.1586
Previous Monthly Low: 1.1289
Daily Fibonacci 38.2%: 1.1327
Daily Fibonacci 61.8%: 1.1307
Daily Pivot Point S1: 1.1293
Daily Pivot Point S2: 1.1243
Daily Pivot Point S3: 1.121
Daily Pivot Point R1: 1.1376
Daily Pivot Point R2: 1.1409
Daily Pivot Point R3: 1.1459
Note: All information on this page is subject to change. The use of this website constitutes acceptance of our user agreement. Please read our privacy policy and legal disclaimer. Opinions expressed at FXstreet.com are those of the individual authors and do not necessarily represent the opinion of FXstreet.com or its management. Risk Disclosure: Trading foreign exchange on margin carries a high level of risk, and may not be suitable for all investors. The high degree of leverage can work against you as well as for you. Before deciding to invest in foreign exchange you should carefully consider your investment objectives, level of experience, and risk appetite. The possibility exists that you could sustain a loss of some or all of your initial investment and therefore you should not invest money that you cannot afford to lose. You should be aware of all the risks associated with foreign exchange trading, and seek advice from an independent financial advisor if you have any doubts.
Recommended content
Editors’ Picks
EUR/USD trades with negative bias, holds above 1.0700 as traders await US PCE Price Index

EUR/USD edges lower during the Asian session on Friday and moves away from a two-week high, around the 1.0740 area touched the previous day. Spot prices trade around the 1.0725-1.0720 region and remain at the mercy of the US Dollar price dynamics ahead of the crucial US data.
USD/JPY jumps above 156.00 on BoJ's steady policy

USD/JPY has come under intense buying pressure, surging past 156.00 after the Bank of Japan kept the key rate unchanged but tweaked its policy statement. The BoJ maintained its fiscal year 2024 and 2025 core inflation forecasts, disappointing the Japanese Yen buyers.
Gold price flatlines as traders look to US PCE Price Index for some meaningful impetus

Gold price lacks any firm intraday direction and is influenced by a combination of diverging forces. The weaker US GDP print and a rise in US inflation benefit the metal amid subdued USD demand. Hawkish Fed expectations cap the upside as traders await the release of the US PCE Price Index.
Sei Price Prediction: SEI is in the zone of interest after a 10% leap

Sei price has been in recovery mode for almost ten days now, following a fall of almost 65% beginning in mid-March. While the SEI bulls continue to show strength, the uptrend could prove premature as massive bearish sentiment hovers above the altcoin’s price.
US economy: Slower growth with stronger inflation

The US Dollar strengthened, and stocks fell after statistical data from the US. The focus was on the preliminary estimate of GDP for the first quarter. Annualised quarterly growth came in at just 1.6%, down from the 2.5% and 3.4% previously forecast.