|

EUR/USD Price Analysis: Weekly chart indicator turns bearish for first since May

  • EUR/USD's weekly MACD shows a bullish-to-bearish trend change. 
  • While the pair bounced last week, it is not out of the woods yet. 

EUR/USD jumped 0.74% last week, trimming the previous week's 1.77% decline. 

However, the currency pair is not out of the woods yet, as a widely-tracked longer duration technical indicator has flipped bearish for the first time since May. 

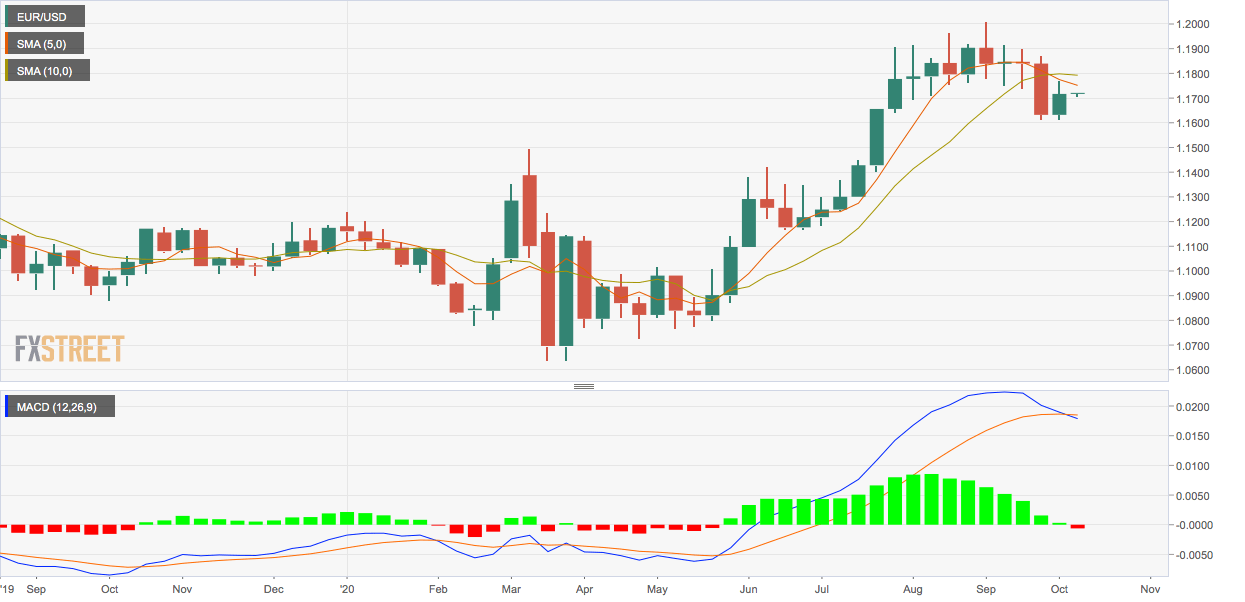
The MACD histogram, an indicator used to identify trend changes and trend strength, has crossed below zero for the first time in six months, indicating a bearish reversal. 

The 5- and 10-week simple moving averages have also produced a bearish crossover. 

As such, a re-test of the recent low of 1.1612 cannot be ruled out. A violation there would expose 1.1495 (March 9 high). 

On the higher side, the 50-day SMA at 1.18 is the level to beat for the bulls, followed by 1.1918 (Sept. 10 high). The pair is currently trading largely unchanged on the day at 1.1720.

Weekly chart

Trend: Bearish

Technical levels

EUR/USD

Overview
Today last price1.172
Today Daily Change0.0003
Today Daily Change %0.03
Today daily open1.1717
 
Trends
Daily SMA201.1766
Daily SMA501.1802
Daily SMA1001.1525
Daily SMA2001.1252
 
Levels
Previous Daily High1.175
Previous Daily Low1.1696
Previous Weekly High1.177
Previous Weekly Low1.1615
Previous Monthly High1.2011
Previous Monthly Low1.1612
Daily Fibonacci 38.2%1.1717
Daily Fibonacci 61.8%1.173
Daily Pivot Point S11.1692
Daily Pivot Point S21.1666
Daily Pivot Point S31.1637
Daily Pivot Point R11.1746
Daily Pivot Point R21.1776
Daily Pivot Point R31.1801

Author

Omkar Godbole

Omkar Godbole

FXStreet Contributor

Omkar Godbole, editor and analyst, joined FXStreet after four years as a research analyst at several Indian brokerage companies.

More from Omkar Godbole
Share:

Editor's Picks

EUR/USD recedes to daily lows near 1.1850

EUR/USD keeps its bearish momentum well in place, slipping back to the area of 1.1850 to hit daily lows on Monday. The pair’s continuation of the leg lower comes amid decent gains in the US Dollar in a context of scarce volatility and thin trade conditions due to the inactivity in the US markets.

GBP/USD resumes the downtrend, back to the low-1.3600s

GBP/USD rapidly leaves behind Friday’s decent advance, refocusing on the downside and retreating to the 1.3630 region at the beginning of the week. In the meantime, the British Pound is expected to remain under the microscope ahead of the release of the key UK labour market report on Tuesday.

Gold looks inconclusive around $5,000

Gold partially fades Friday’s strong recovery, orbiting around the key $5,000 region per troy ounce in a context of humble gains in the Greenback on Monday. Additing to the vacillating mood, trade conditions remain thin amid the observance of the Presidents Day holiday in the US.

Bitcoin consolidates as on-chain data show mixed signals

Bitcoin price has consolidated between $65,700 and $72,000 over the past nine days, with no clear directional bias. US-listed spot ETFs recorded a $359.91 million weekly outflow, marking the fourth consecutive week of withdrawals.

The week ahead: Key inflation readings and why the AI trade could be overdone

It is likely to be a quiet start to the week, with US markets closed on Monday for Presidents Day. European markets are higher across the board and gold is clinging to the $5,000 level after the tamer than expected CPI report in the US reduced haven flows to precious metals.

XRP steadies in narrow range as fund inflows, futures interest rise

Ripple is trading in a narrow range between $1.45 (immediate support) and $1.50 (resistance) at the time of writing on Monday. The remittance token extended its recovery last week, peaking at $1.67 on Sunday from the weekly open at $1.43.