|

EUR/USD Price Analysis: Euro suffers the worst weekly decline since November 2019

  • EUR/USD registers its worst weekly decline in three months.
  • Downside targets can be located near the 1.0912 and 1.0877 levels.
 

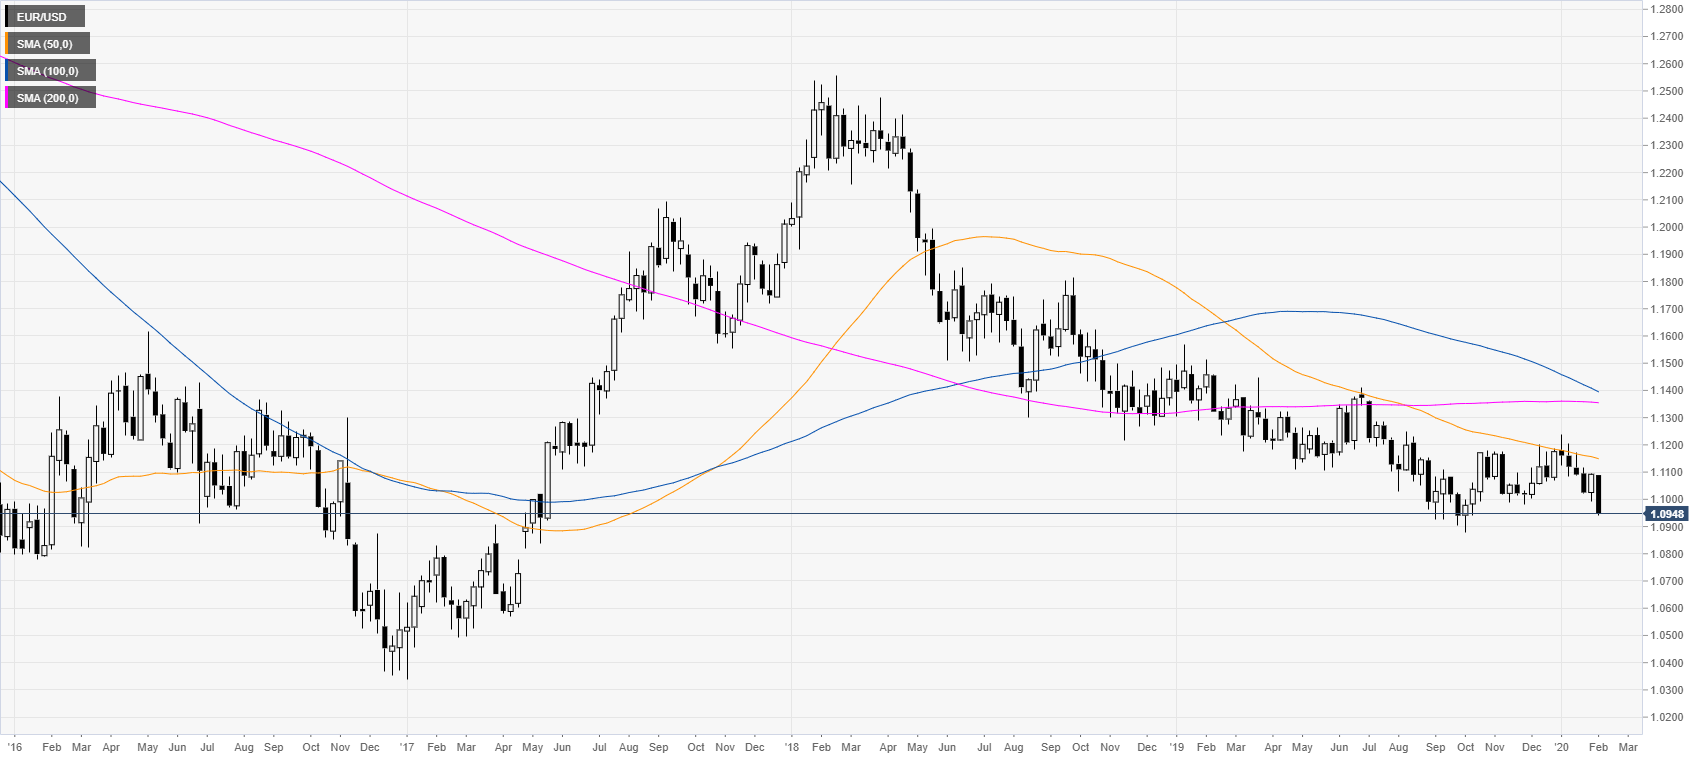
EUR/USD weekly chart

 
EUR/USD is trading below its main weekly simple moving averages (SMAs) suggesting a bearish bias in the long term. The euro had its worst weekly decline since November 2019. 
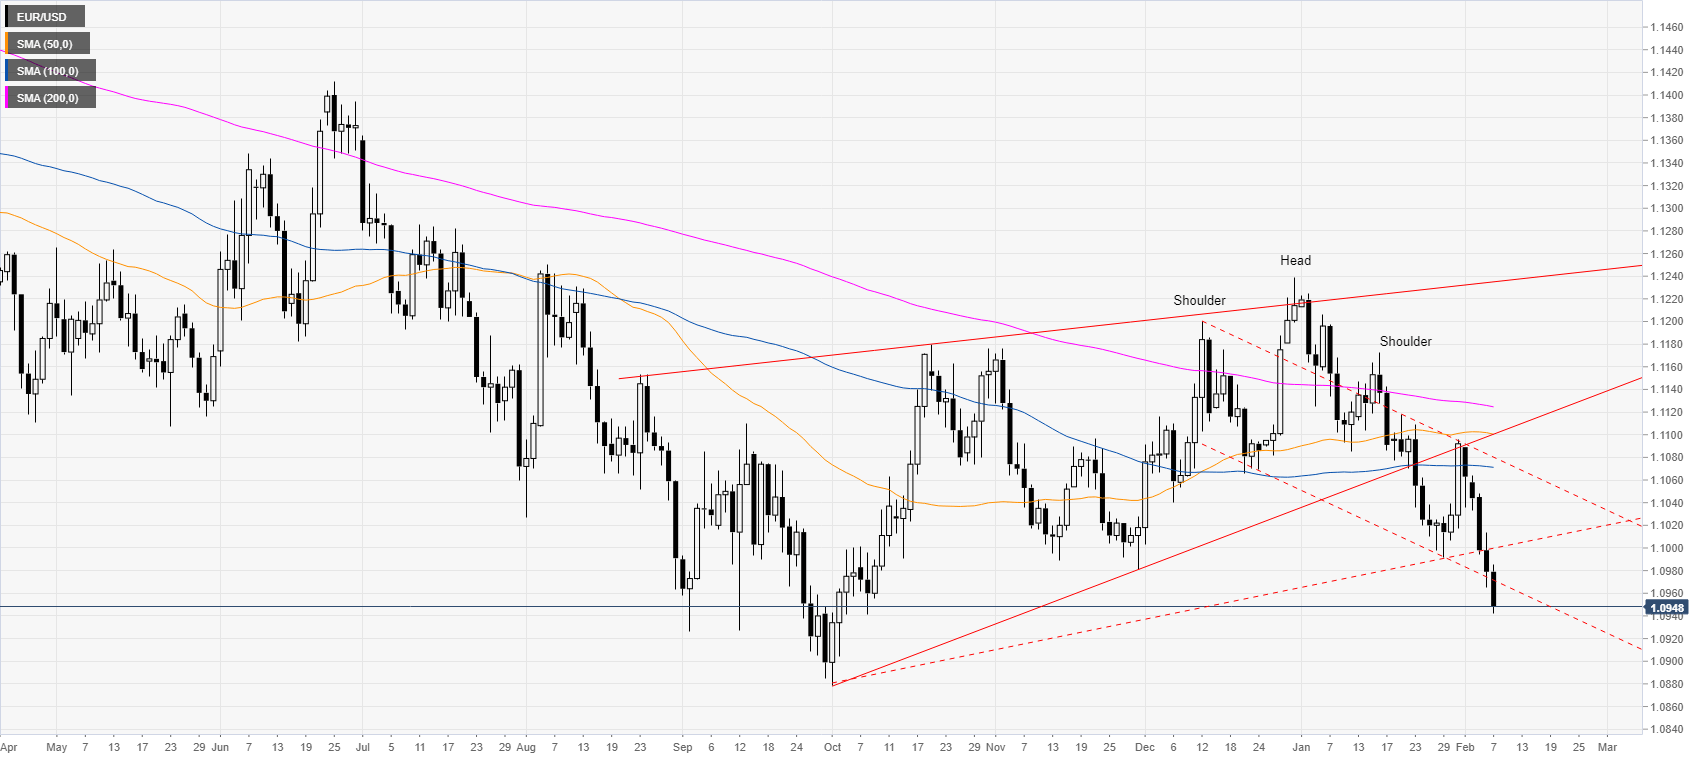
 

EUR/USD daily chart 

 
The euro is trading in a weak downtrend below the main simple moving averages (SMAs) as the spot is melting to levels not seen since October 2019. This Friday the Non-farm payrolls revealed that the US added 225K jobs vs. 160K forecast by analysts. 
 

EUR/USD four-hour chart

 
EUR/USD is trading in a downward channel below its main SMAs while sellers are looking for a break below the 1.0930 support. As the spot stays under strong selling pressure, a break below the above-mentioned level is likely to lead to further declines towards the 1.0912 and 1.0877 levels, according to the Technical Confluences Indicator. Resistances are seen near 1.0964, 1.0980 and the 1.1000 figure.
 
 
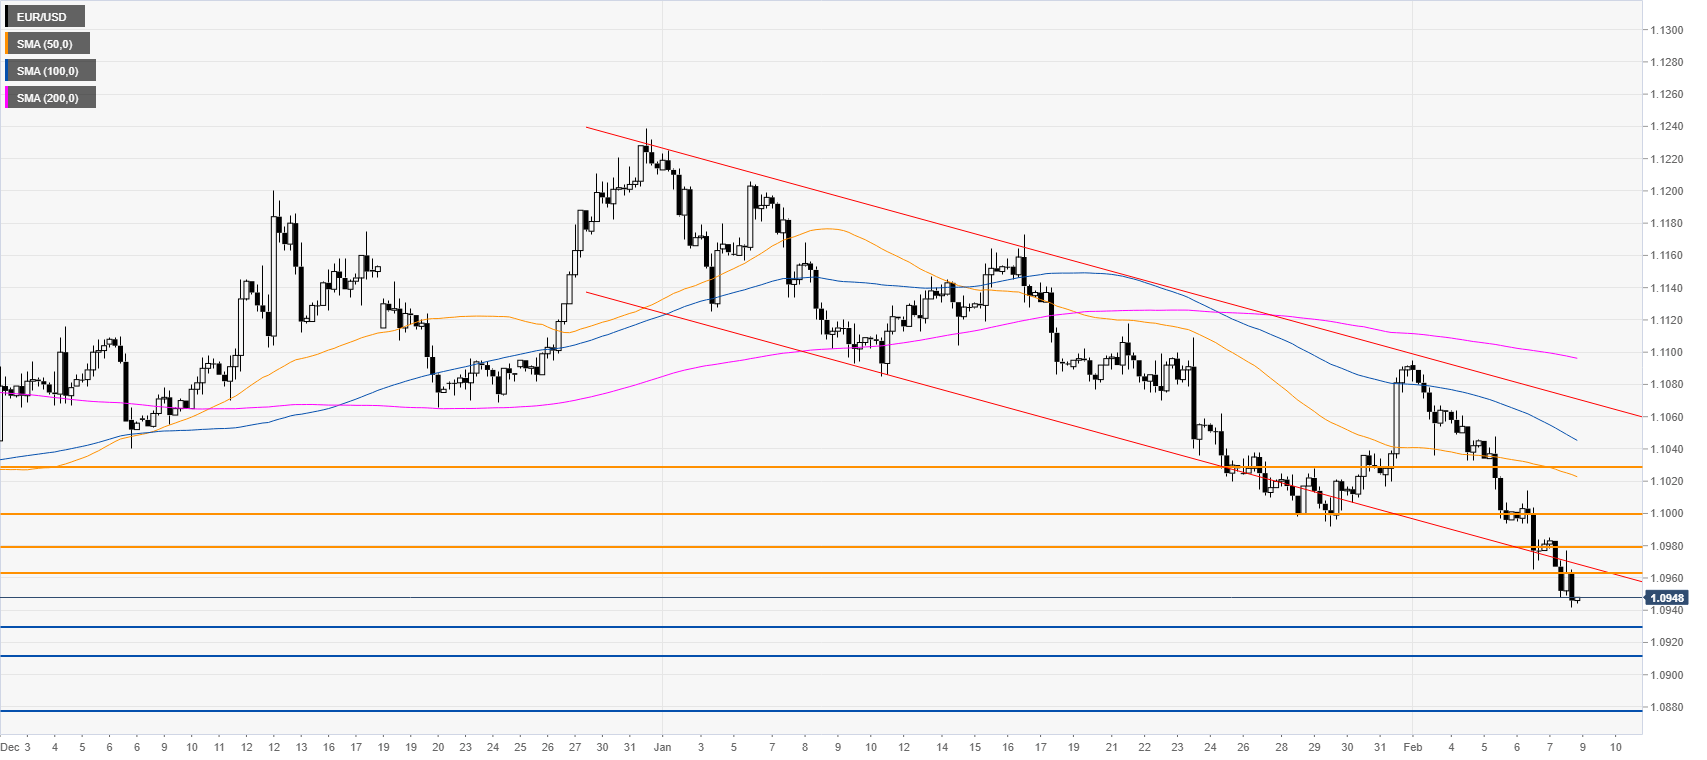
Resistance: 1.0964, 1.0980, 1.1000
Support: 1.0930, 1.0912, 1.0877


Additional key levels 

EUR/USD

Overview
Today last price1.0948
Today Daily Change-0.0031
Today Daily Change %-0.28
Today daily open1.0979
 
Trends
Daily SMA201.1069
Daily SMA501.1101
Daily SMA1001.1071
Daily SMA2001.1125
 
Levels
Previous Daily High1.1014
Previous Daily Low1.0965
Previous Weekly High1.1092
Previous Weekly Low1.0992
Previous Monthly High1.1225
Previous Monthly Low1.0992
Daily Fibonacci 38.2%1.0984
Daily Fibonacci 61.8%1.0995
Daily Pivot Point S11.0958
Daily Pivot Point S21.0937
Daily Pivot Point S31.0909
Daily Pivot Point R11.1007
Daily Pivot Point R21.1035
Daily Pivot Point R31.1056

Author

Flavio Tosti

Flavio Tosti

Independent Analyst


More from Flavio Tosti
Share:

Editor's Picks

EUR/USD slumps below 1.1750 as USD benefits from risk-aversion

EUR/USD comes under renewed bearish pressure in the European session and trades below 1.1750 following a recovery attempt earlier in the day. The US Dollar gathers strength and weighs on the pair as investors seek refuge in the wake of Israel and the United States' joint attack on Iran.

GBP/USD targets 1.3500 barrier near moving averages

GBP/USD rebounds from the daily losses, trading around 1.3450 during the Asian hours on Monday. The technical analysis of the daily chart indicates an ongoing bearish bias, as the pair trades within a descending channel pattern.

Gold surges on safe-haven demand, rises above $5,400

Gold benefits from intense risk-aversion on Monday and climbs above $5,400, setting a fresh monthly-high in the process. Tensions in the Middle East remain high as Israel and Hezbollah continue to exchange strikes following the US-Israel joint attack on Iran over the weekend.

Bitcoin, Ethereum and Ripple under pressure as key supports face breakdown risk

Bitcoin, Ethereum, and Ripple prices trade on the back foot at the start of this week on Monday, after extending losses in the previous week. BTC is on the brink of a breakdown, ETH is capped below key resistance, and XRP risks a crack of the trendline.

The market is paying for insurance, not apocalypse

As expected, this morning felt less like a Monday market open and more like a fire drill. Futures screens flickered red. S&P contracts down almost 1%. Nasdaq off 1.2%. Brent leaped 13% through $80. Gold rose 1.6% toward $5350 before paring some gains. The dollar is strutting mildly. The Swiss franc is quietly doing what it always does in a storm, catching some safe-haven flows.

Pi Network Price Forecast: Core team offloads supply, weighing on PI recovery

Pi Network  hovers below $0.1700, broadly steady at press time on Monday, attempting a recovery after a 2% loss the previous day. Sunday’s decline aligned with nearly 49 million PI tokens offloaded by the Pi Foundation, implying a spike in supply pressure that capped the prevailing four-day recovery.