EUR/USD Price Analysis: Bulls eye 1.1385 resistance on the key day


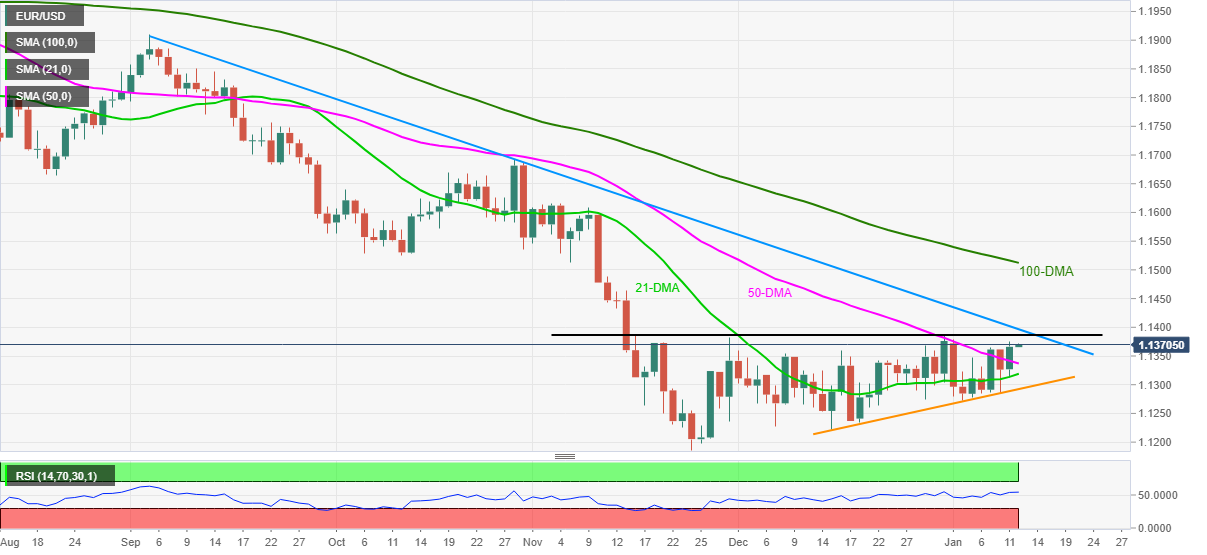
  • EUR/USD grinds higher following the strong rebound from 21-DMA that crossed 50-DMA hurdle.
  • 10-week-old horizontal resistance challenges immediate upside ahead of descending trend line from early September.
  • Higher lows of prices, RSI keep buyers hopeful.
  • Sellers need to conquer monthly support line to retake controls.

EUR/USD retreats from weekly top to 1.1365 during Wednesday’s Asian session. Even so, the major currency pair remains on the buyer’s radar as they brace for the key US inflation data.

Read: US Consumer Price Index December Preview: The Fed’s die is cast

The quote not only bounced off 21-DMA but also crossed the 50-DMA to post a considerable upside bias the previous day. Additionally, the pair’s recently higher lows of prices join the same pattern on RSI to also portray a bullish scenario.

However, double tops marked since mid-November around 1.1385 guard the quote’s immediate upside, a break of which will direct EUR/USD buyers towards a multi-day-old descending trend line resistance near 1.1400.

It should be noted, though, that a clear run-up beyond the 1.1400 threshold will be enough to propel the quote towards the 100-DMA level of 1.1512 and then to October’s low near 1.1525.

Meanwhile, pullback moves may initially be challenged by the 21-DMA and 50-DMA, close to 1.1335 and 1.1320 in that order.

Following that, an ascending support line from December 15, near 1.1290, becomes crucial to watch as a break of which will recall the EUR/USD sellers targeting 2021 low of 1.1186.

EUR/USD: Daily chart

Trend: Further upside expected

Additional important levels

Overview
Today last price 1.1368
Today Daily Change 0.0002
Today Daily Change % 0.02%
Today daily open 1.1366
 
Trends
Daily SMA20 1.1317
Daily SMA50 1.1342
Daily SMA100 1.1516
Daily SMA200 1.1738
 
Levels
Previous Daily High 1.1375
Previous Daily Low 1.1313
Previous Weekly High 1.1379
Previous Weekly Low 1.1272
Previous Monthly High 1.1386
Previous Monthly Low 1.1222
Daily Fibonacci 38.2% 1.1352
Daily Fibonacci 61.8% 1.1337
Daily Pivot Point S1 1.1328
Daily Pivot Point S2 1.1289
Daily Pivot Point S3 1.1265
Daily Pivot Point R1 1.139
Daily Pivot Point R2 1.1414
Daily Pivot Point R3 1.1452


Share: Feed news

Information on these pages contains forward-looking statements that involve risks and uncertainties. Markets and instruments profiled on this page are for informational purposes only and should not in any way come across as a recommendation to buy or sell in these assets. You should do your own thorough research before making any investment decisions. FXStreet does not in any way guarantee that this information is free from mistakes, errors, or material misstatements. It also does not guarantee that this information is of a timely nature. Investing in Open Markets involves a great deal of risk, including the loss of all or a portion of your investment, as well as emotional distress. All risks, losses and costs associated with investing, including total loss of principal, are your responsibility. The views and opinions expressed in this article are those of the authors and do not necessarily reflect the official policy or position of FXStreet nor its advertisers. The author will not be held responsible for information that is found at the end of links posted on this page.

If not otherwise explicitly mentioned in the body of the article, at the time of writing, the author has no position in any stock mentioned in this article and no business relationship with any company mentioned. The author has not received compensation for writing this article, other than from FXStreet.

FXStreet and the author do not provide personalized recommendations. The author makes no representations as to the accuracy, completeness, or suitability of this information. FXStreet and the author will not be liable for any errors, omissions or any losses, injuries or damages arising from this information and its display or use. Errors and omissions excepted.

The author and FXStreet are not registered investment advisors and nothing in this article is intended to be investment advice.

Recommended content


Recommended content

Editors’ Picks

AUD/USD bounces to 0.6450, shrugs off mixed Australian jobs data

AUD/USD bounces to 0.6450, shrugs off mixed Australian jobs data

AUD/USD is rebounding to test 0.6450 amid renewed US Dollar weakness in the Asian session on Thursday. The pair reverses mixed Australian employment data-led minor losses, as risk sentiment recovers. 

AUD/USD News

USD/JPY bounces back toward 154.50 amid risk-recovery

USD/JPY bounces back toward 154.50 amid risk-recovery

USD/JPY bounces back toward 154.50 in Asian trading on Thursday, having tested 154.00 on the latest US Dollar pullback and Japan's FX intervention risks. A recovery in risk appetite is aiding the rebound in the pair. 

USD/JPY News

Gold rebounds on market caution, aims to reach $2,400

Gold rebounds on market caution, aims to reach $2,400

Gold price recovers its recent losses, trading around $2,370 per troy ounce during the Asian session on Thursday. The safe-haven yellow metal gains ground as traders exercise caution amidst heightened geopolitical tensions in the Middle East.

Gold News

Manta Network price braces for volatility as $44 million worth of MANTA is due to flood markets

Manta Network price braces for volatility as $44 million worth of MANTA is due to flood markets

Manta Network price was not spared from the broader market crash instigated by a weakness in the Bitcoin market. While analysts call a bottoming out in the BTC price, the Web3 modular ecosystem token could suffer further impact.

Read more

Investors hunkering down

Investors hunkering down

Amidst a relentless cautionary deluge of commentary from global financial leaders gathered at the International Monetary Fund and World Bank Spring meetings in Washington, investors appear to be taking a hiatus after witnessing significant market movements in recent weeks.

Read more

Forex MAJORS

Cryptocurrencies

Signatures