|

EUR/USD Price Analysis: Bulls await a move beyond 1.1015 before placing fresh bets

  • EUR/USD continues to draw support from the divergent ECB-Fed policy outlook.
  • The technical setup favours bullish traders and supports prospects for further gains.
  • Some follow-through buying beyond the 1.1015 area will reaffirm the positive bias.

The EUR/USD pair trades with a positive bias for the fifth day in a row on Friday and is currently placed just below the 1.1000 psychological mark, or a two-week high touched the previous day.

The shared currency continues to draw support from the fact that the European Central Bank (ECB) on Thursday reaffirmed the need to hold interest rates higher for longer. In contrast, the Federal Reserve (Fed) indicated that rate cuts are likely next year and drag the US Dollar (USD) to over a four-month low during the Asian session, which, in turn, is seen acting as a tailwind for the EUR/USD pair.

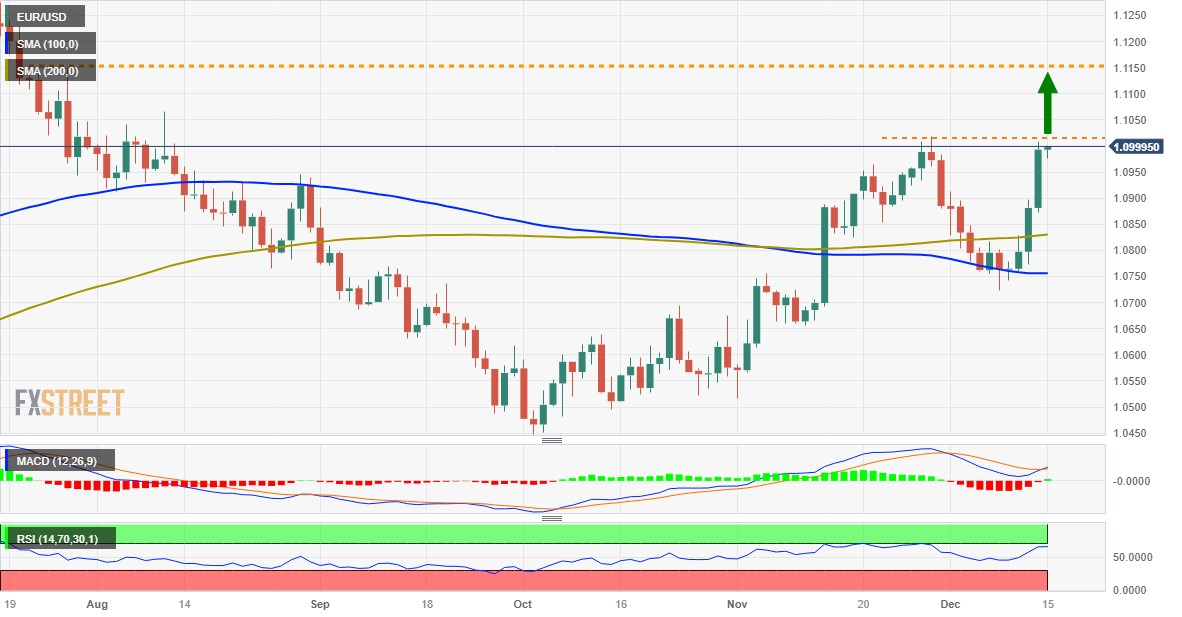
From a technical perspective, spot prices showed some resilience below the 100-day Simple Moving Average (SMA) earlier this week. A subsequent rally of over 250 pips from the 1.0740 region, or a near one-month low favours bullish traders. Moreover, oscillators on the daily chart are holding comfortably in the positive territory and validate the near-term constructive outlook for the EUR/USD pair.

That said, it will still be prudent to wait for some follow-through buying beyond the 1.1015 area, or a multi-month peak touched in November, before positioning for any further gains. The EUR/USD pair might then accelerate the momentum towards the 1.1065 region (August monthly top) before aiming to reclaim the 1.1100 mark and test the next relevant hurdle near the mid-1.1100s (July 27 high).

On the flip side, the 1.0945 region now seems to protect the immediate downside, below which the EUR/USD pair could slide back to test sub-1.0900 levels. Some follow-through selling will negate the positive outlook and drag spot prices to the 200-day SMA support, currently near the 1.0830-1.0825 area. The subsequent fall below the 1.0800 mark could expose the 100-day SMA, around the 1.0755 zone.

EUR/USD daily chart

fxsoriginal

Technical levels to watch

EUR/USD

Overview
Today last price1.0998
Today Daily Change0.0005
Today Daily Change %0.05
Today daily open1.0993
 
Trends
Daily SMA201.0878
Daily SMA501.0733
Daily SMA1001.0756
Daily SMA2001.0828
 
Levels
Previous Daily High1.1009
Previous Daily Low1.0872
Previous Weekly High1.0895
Previous Weekly Low1.0724
Previous Monthly High1.1017
Previous Monthly Low1.0517
Daily Fibonacci 38.2%1.0957
Daily Fibonacci 61.8%1.0924
Daily Pivot Point S11.0907
Daily Pivot Point S21.0821
Daily Pivot Point S31.077
Daily Pivot Point R11.1044
Daily Pivot Point R21.1095
Daily Pivot Point R31.1181

(This story was corrected on December 15 at 08:45 GMT to say, in the third paragraph, that EUR/USD rallied over 250 pips, not 25 pips, and to say, in the last paragraph, that some follow-through selling will negate the positive outlook, not follow-through buying.)

Author

Haresh Menghani

Haresh Menghani is a detail-oriented professional with 10+ years of extensive experience in analysing the global financial markets.

More from Haresh Menghani
Share:

Editor's Picks

EUR/USD rises to 1.1800 neighborhood amid renewed USD selling and trade uncertainties

The EUR/USD pair regains positive traction during the Asian session on Wednesday and jumps to the 1.1800 neighborhood in the last hour, reversing the previous day's modest losses. The intraday move up is sponsored by the emergence of fresh US Dollar, which continues to be weighed down by persistent trade-related uncertainties.

GBP/USD remains stronger above 1.3500 following Trump’s State of the Union

GBP/USD remains in the positive territory for the fourth successive session, trading around 1.3510 during the Asian hours on Wednesday. The pair appreciates as the US Dollar remains subdued following US President Donald Trump’s first State of the Union address of his second administration before a joint session of Congress.

Gold re-attempts $5,200 amid tariffs and geopolitical woes

Gold buyers are back in the game early Wednesday after seeing a correction from monthly highs on Tuesday. The US Dollar slips after Trump’s SOTU fails to impress and as AI-driven worries ease. Dovish Fed bets also weigh.  Gold looks north so long as the key 61.8% Fibo resistance at $5,142 holds on the daily chart.

Bitcoin, Ethereum and Ripple post cautious recovery amid downside risks

Bitcoin, Ethereum, and Ripple are posting a cautious recovery on Wednesday following a market correction earlier this week.  BTC is approaching a key breakdown level, while ETH and XRP are rebounding from crucial support levels.

The Citrini report: How a debatable AI narrative can shake Wall Street

That AI-related headline alone was enough to rattle investors.US stocks slid sharply on Monday after a widely circulated Citrini Research memo outlined a hypothetical “2028 Global Intelligence Crisis”, warning that rapid AI adoption could push US unemployment into double digits as early as by mid-2028.

Cosmos Hub Price Forecast: ATOM rebounds slightly, bearish outlook remains intact

Cosmos Hub (ATOM) price rebounds, trading above $2.05 at the time of writing on Wednesday, after undergoing a sharp correction since last week. Weakening on-chain and derivatives data support a bearish outlook, while technical analysis remains unfavorable.