EUR/USD Price Analysis: Bearish RSI divergence on the daily chart
- EUR/USD's daily chart shows a bearish RSI divergence.
- The pair looks to have carved out a temporary top above 1.19.

EUR/USD fell by nearly 0.80% on Wednesday as the oversold dollar picked up a bid after the Federal Reserve minutes pushed back against measures like yield curve control.
Wednesday’s decline confirmed another lower high on the 14-day relative strength index. The indicator has charted multiple lower highs, contradicting higher highs on the price chart over the past three days.
That bearish divergence suggests the bullish trend is running out of steam. As such, the spot could witness a notable pullback in the near term. The immediate support is seen at 1.1724 – the lower end of the daily chart sideways channel. A violation there would expose the former resistance-turned-support at 1.1495 (March high).
The bullish view would be restored if the daily chart sideways channel is breached to the higher side. At press time, the pair is trading near 1.1840.
Daily chart
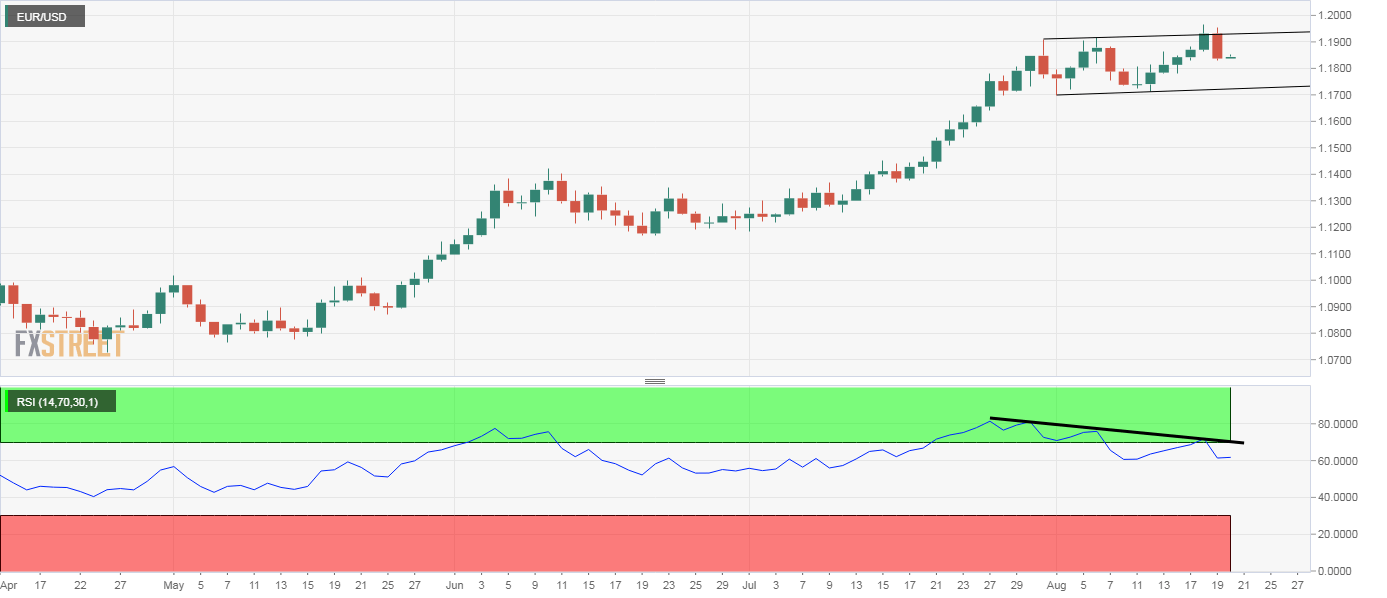
Trend: Bearish
Technical levels
Author

Omkar Godbole
FXStreet Contributor
Omkar Godbole, editor and analyst, joined FXStreet after four years as a research analyst at several Indian brokerage companies.


