EUR/USD Price Analysis: Battling 50-HMA after falling wedge breakout


  • EUR/USD bulls await fresh impetus for the next leg up.
  • Falling wedge breakout confirmed on the hourly chart.
  • EUR bulls struggling to extend gains above 50-HMA.

EUR/USD is off the highs but remains better bid above 1.1700, as the US dollar remains on the back foot amid the upbeat market mood.

The optimism over US President Donald Trump’s potential discharge from the medical center boosts the appetite for the risk assets at the expense of the safe-haven greenback.

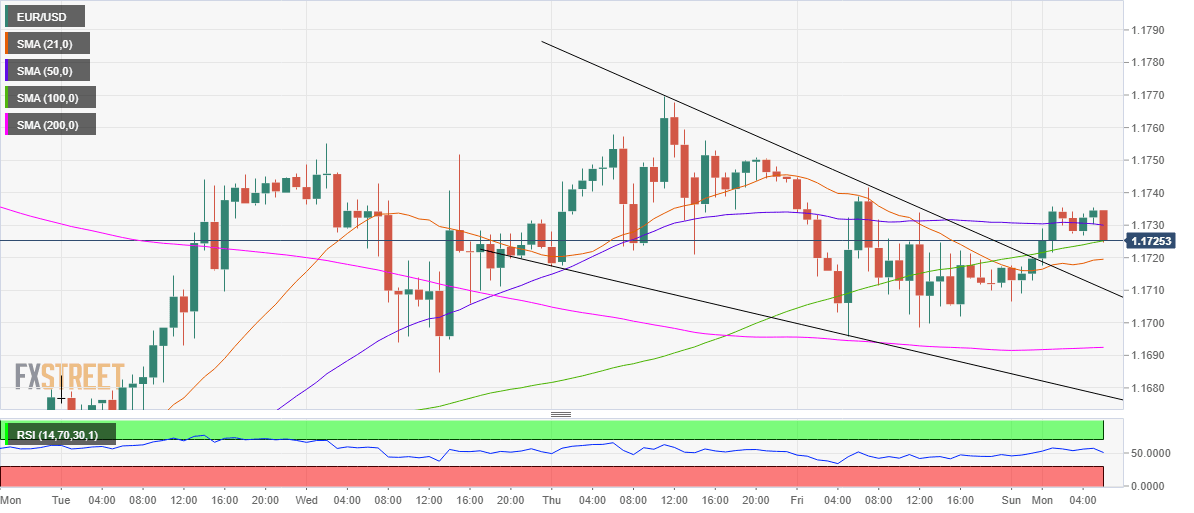
From a near-term technical perspective, the bulls are catching a breath following a nearly 30-pips bounce from daily lows of 1.1709, courtesy of the falling wedge breakout confirmed on the hourly chart.

Despite the bullish breakout, the spot is struggling to extend the rise above the horizontal 50-hourly Simple Moving Average (HMA) at 1.1730.

A sustained move above the latter could open doors once again towards the pattern target of 1.1793. However, the October 1 high of 1.1770 could test the bulls’ commitment en route the aforesaid pattern target.

The hourly Relative Strength Index (RSI) has turned south at 51.94, suggesting that the bullish momentum could weaken in the coming hours.

The immediate downside could be capped around 1.1725/20, which is the confluence of the 21 and 100-HMAs.

On a failure to resist above the latter, sellers could target the pattern resistance now support at 1.1710.

The horizontal critical 200-HMA support at 1.1692 is the level to beat for the EUR bears.

EUR/USD: Hourly chart

fxsoriginal

EUR/USD: Additional levels

EUR/USD

Overview
Today last price 1.1726
Today Daily Change 0.0010
Today Daily Change % 0.09
Today daily open 1.1717
 
Trends
Daily SMA20 1.1766
Daily SMA50 1.1802
Daily SMA100 1.1525
Daily SMA200 1.1252
 
Levels
Previous Daily High 1.175
Previous Daily Low 1.1696
Previous Weekly High 1.177
Previous Weekly Low 1.1615
Previous Monthly High 1.2011
Previous Monthly Low 1.1612
Daily Fibonacci 38.2% 1.1717
Daily Fibonacci 61.8% 1.173
Daily Pivot Point S1 1.1692
Daily Pivot Point S2 1.1666
Daily Pivot Point S3 1.1637
Daily Pivot Point R1 1.1746
Daily Pivot Point R2 1.1776
Daily Pivot Point R3 1.1801


Share: Feed news

Information on these pages contains forward-looking statements that involve risks and uncertainties. Markets and instruments profiled on this page are for informational purposes only and should not in any way come across as a recommendation to buy or sell in these assets. You should do your own thorough research before making any investment decisions. FXStreet does not in any way guarantee that this information is free from mistakes, errors, or material misstatements. It also does not guarantee that this information is of a timely nature. Investing in Open Markets involves a great deal of risk, including the loss of all or a portion of your investment, as well as emotional distress. All risks, losses and costs associated with investing, including total loss of principal, are your responsibility. The views and opinions expressed in this article are those of the authors and do not necessarily reflect the official policy or position of FXStreet nor its advertisers. The author will not be held responsible for information that is found at the end of links posted on this page.

If not otherwise explicitly mentioned in the body of the article, at the time of writing, the author has no position in any stock mentioned in this article and no business relationship with any company mentioned. The author has not received compensation for writing this article, other than from FXStreet.

FXStreet and the author do not provide personalized recommendations. The author makes no representations as to the accuracy, completeness, or suitability of this information. FXStreet and the author will not be liable for any errors, omissions or any losses, injuries or damages arising from this information and its display or use. Errors and omissions excepted.

The author and FXStreet are not registered investment advisors and nothing in this article is intended to be investment advice.

Recommended content


Recommended content

Editors’ Picks

EUR/USD edges lower toward 1.0700 post-US PCE

EUR/USD edges lower toward 1.0700 post-US PCE

EUR/USD stays under modest bearish pressure but manages to hold above 1.0700 in the American session on Friday. The US Dollar (USD) gathers strength against its rivals after the stronger-than-forecast PCE inflation data, not allowing the pair to gain traction.

EUR/USD News

GBP/USD retreats to 1.2500 on renewed USD strength

GBP/USD retreats to 1.2500 on renewed USD strength

GBP/USD lost its traction and turned negative on the day near 1.2500. Following the stronger-than-expected PCE inflation readings from the US, the USD stays resilient and makes it difficult for the pair to gather recovery momentum.

GBP/USD News

Gold struggles to hold above $2,350 following US inflation

Gold struggles to hold above $2,350 following US inflation

Gold turned south and declined toward $2,340, erasing a large portion of its daily gains, as the USD benefited from PCE inflation data. The benchmark 10-year US yield, however, stays in negative territory and helps XAU/USD limit its losses. 

Gold News

Bitcoin Weekly Forecast: BTC’s next breakout could propel it to $80,000 Premium

Bitcoin Weekly Forecast: BTC’s next breakout could propel it to $80,000

Bitcoin’s recent price consolidation could be nearing its end as technical indicators and on-chain metrics suggest a potential upward breakout. However, this move would not be straightforward and could punish impatient investors. 

Read more

Week ahead – Hawkish risk as Fed and NFP on tap, Eurozone data eyed too

Week ahead – Hawkish risk as Fed and NFP on tap, Eurozone data eyed too

Fed meets on Wednesday as US inflation stays elevated. Will Friday’s jobs report bring relief or more angst for the markets? Eurozone flash GDP and CPI numbers in focus for the Euro.

Read more

Forex MAJORS

Cryptocurrencies

Signatures