EUR/USD: Diverging interest rate expectations an overall bearish factor
- EUR/USD finds temporary support from a lack of escalation in the Israel-Iran conflict.
- Diverging interest rate expectations are an overall bearish factor however.
- EUR/USD may be forming a Bear Flag price pattern.

EUR/USD continues to trade within a contained box-like range. It is down two tenths of a percentage point in the 1.0630s on Monday, after briefly rising during the European session on a lack of escalation in the Israel-Iran conflict.
Most analysts are overall bearish EUR/USD, however, because of a diverging outlook for future path of interest rates – a key FX driver – in the US as compared to Europe, and this seems to be pushing the pair lower as the day progresses.
EUR/USD doomed by diverging interest rates
EUR/USD is expected to continue weakening by many experts because of the comparative outlook for interest rates, which drive capital flows. Interest rates are expected to remain higher in the US compared to Europe, making it a more attractive place to store capital, thereby increasing inflows and Dollar-demand.
On the US side, stubbornly high inflation, a robust jobs market and strong economic growth are all reasons to keep interest rates at their current level (5.25%-5.50%).
“It is hard to find any reasons to bet against the Dollar,” said Michael Pfister, FX Analyst at Commerzbank in an interview with Bloomberg News on Monday. “We have seen an appreciation in the Greenback over the last two weeks on the back of an inflation surprise. On top of that we have a strong growth advantage and a very hawkish Fed,” added the analyst.
Pfister sees the Federal Reserve (Fed) not making a first rate cut until December, which is a big change from expectations earlier this year, when the consensus was that the Fed would make its first interest rate cut in June. The Fed themselves, in their last Summary of Economic Projections (SEP), forecast about three 0.25% cuts over the whole of 2024.
This contrasts with Europe, where disinflation has been stronger and economic activity weaker. Additionally, officials at the European Central Bank (ECB) which sets base lending rates for the entire region (currently at 4.5%), appear more united in advocating for a cut in June, compared to their colleagues across the Atlantic.
“To be honest, I am often surprised that the Euro is not much weaker,” says Ulrich Leuchtmann, Head of FX and Commodity Research also at Commerzbank in a note on Monday.
“Over the weekend, news services reported in advance on an interview with François Villeroy de Galhau, Governor of the Banque de France. According to these reports, Villeroy confirmed the ECB Governing Council's intention to cut interest rates at its meeting on June 6,” adds Leuchtmann.
How low could the Euro go? When asked whether he saw EUR/USD falling all the way to parity, Pfister replied “Not quite as low as parity but we see EUR/USD probably falling to 1.0400.”
Technical Analysis: EUR/USD forms potential Bear Flag
EUR/USD has been yo-yoing in a rectangular range since it bottomed at 1.0601 on April 16. The range is roughly at the level of the 100-week Simple Moving Average (SMA).
Taken together with the steep decline that preceded it, the rectangle resembles an almost-complete Bear Flag pattern on the 4-hour chart below.
EUR/USD 4-hour Chart
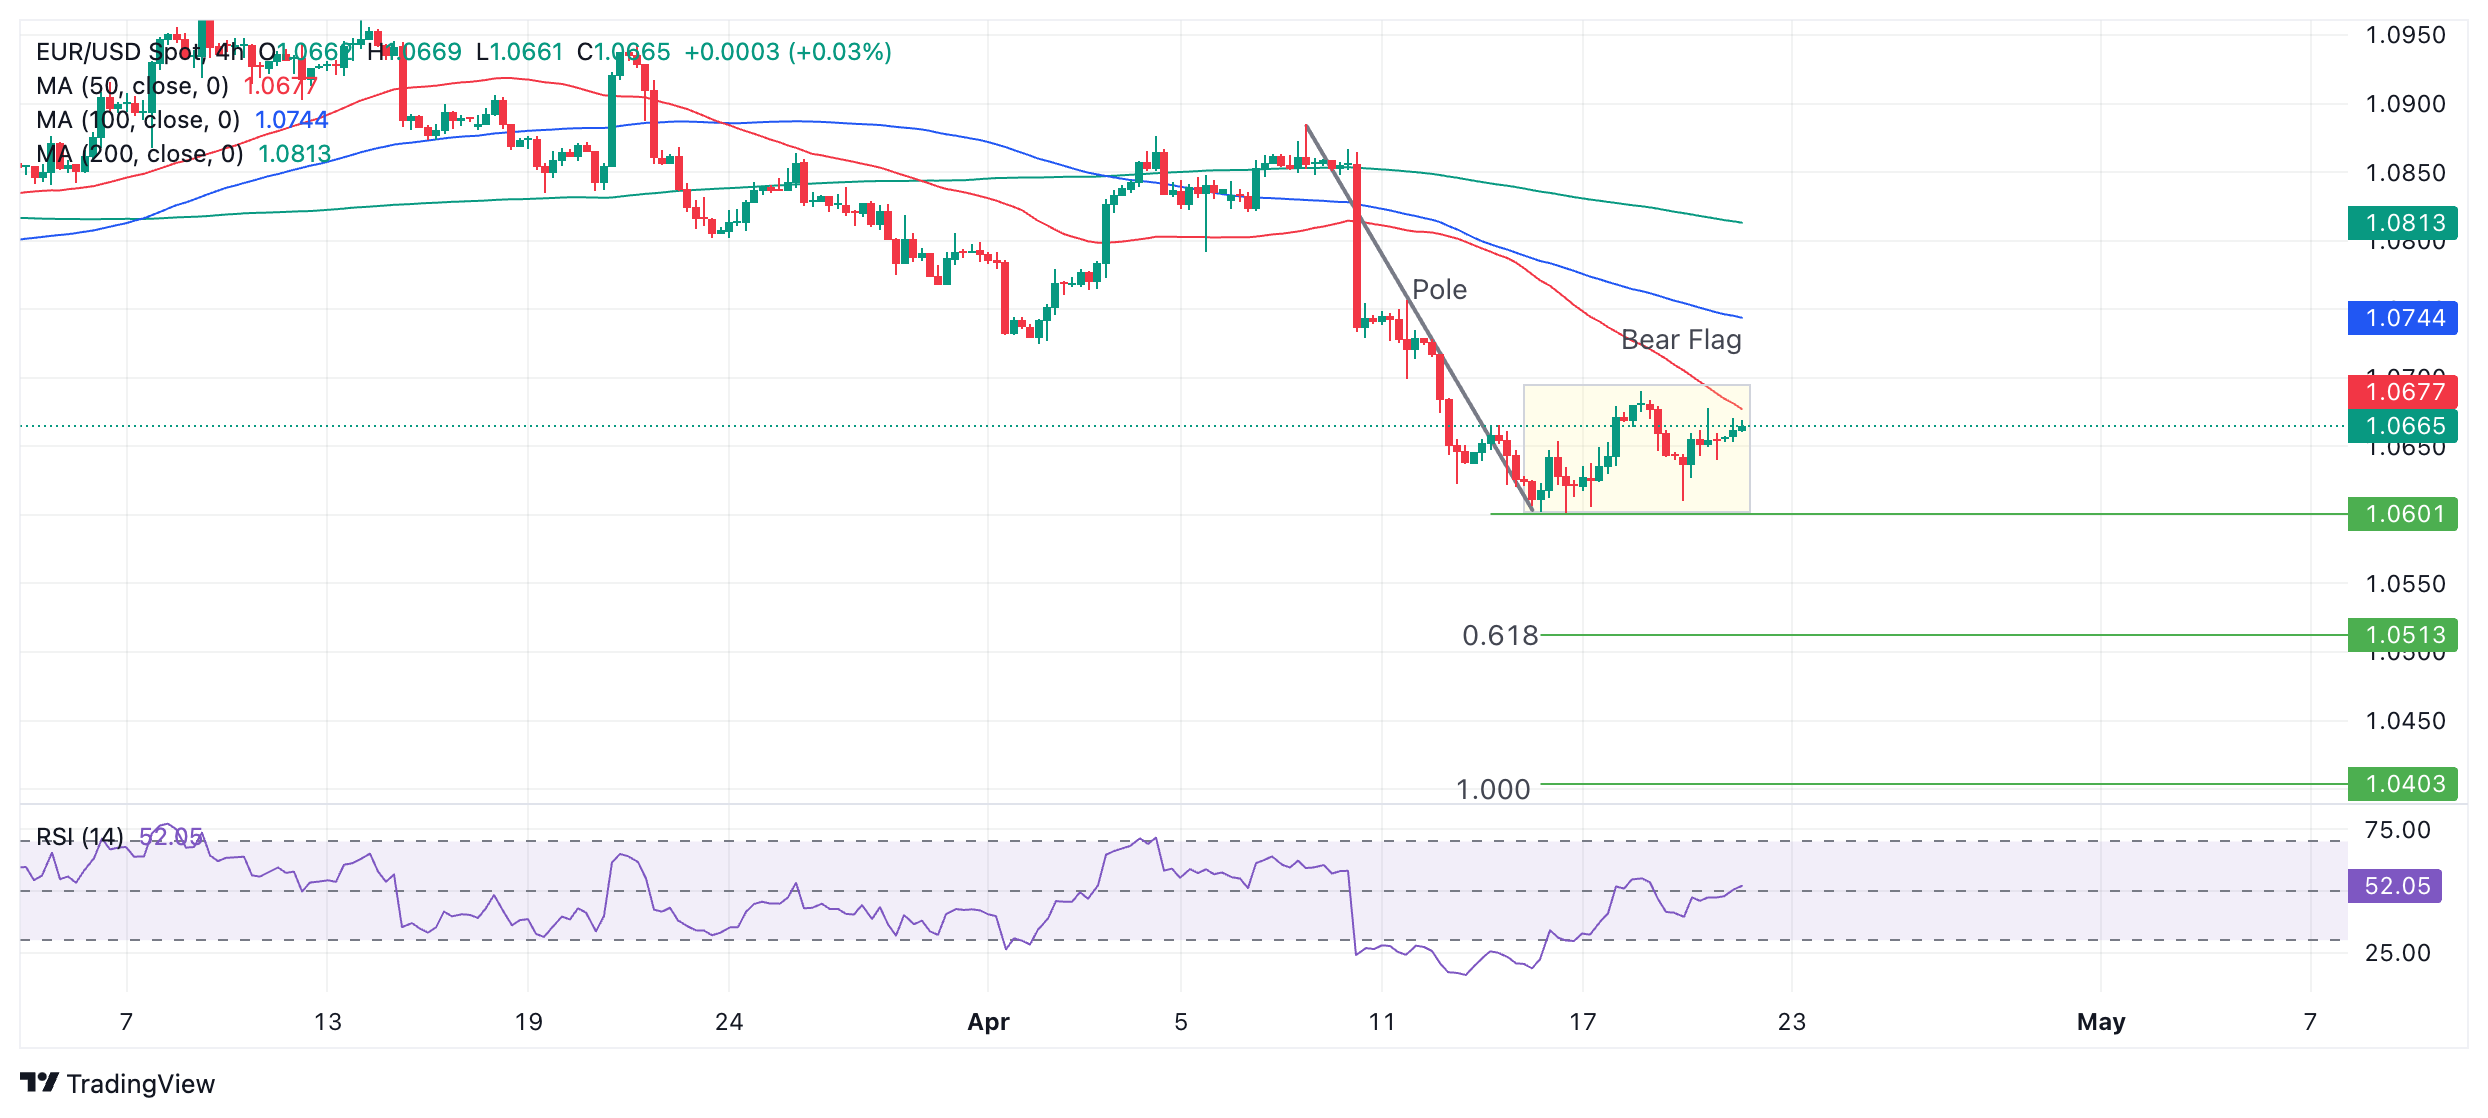
A break below the 1.0601 April 16 low would signal a probable activation of the Bear Flag and the start of a deep decline. Technical analysts forecast the move out of a Bear Flag as equal to the length of the “pole” or the steep decline preceding the box-like formation of the flag square, or a Fibonacci ratio of the pole.
The Fibonacci 0.618 ratio of the pole extrapolated lower provides the most reliable conservative target. This gives a price objective at 1.0503. After that, the next concrete target is at 1.0446 – the October 2023 low. A fall of equal length to the pole would take the exchange rate all the way down to 1.0403.
The Relative Strength Index (RSI) has exited oversold conditions, indicating renewed potential for more downside.
For bulls, resistance at around 1.0700 will need to be overcome to have any hope of recovery. After that, the April 2 swing low at 1.0725 provides the next upside target followed by 1.0800, where a cluster of major Moving Averages coils.
Interest rates FAQs
Interest rates are charged by financial institutions on loans to borrowers and are paid as interest to savers and depositors. They are influenced by base lending rates, which are set by central banks in response to changes in the economy. Central banks normally have a mandate to ensure price stability, which in most cases means targeting a core inflation rate of around 2%. If inflation falls below target the central bank may cut base lending rates, with a view to stimulating lending and boosting the economy. If inflation rises substantially above 2% it normally results in the central bank raising base lending rates in an attempt to lower inflation.
Higher interest rates generally help strengthen a country’s currency as they make it a more attractive place for global investors to park their money.
Higher interest rates overall weigh on the price of Gold because they increase the opportunity cost of holding Gold instead of investing in an interest-bearing asset or placing cash in the bank. If interest rates are high that usually pushes up the price of the US Dollar (USD), and since Gold is priced in Dollars, this has the effect of lowering the price of Gold.
The Fed funds rate is the overnight rate at which US banks lend to each other. It is the oft-quoted headline rate set by the Federal Reserve at its FOMC meetings. It is set as a range, for example 4.75%-5.00%, though the upper limit (in that case 5.00%) is the quoted figure. Market expectations for future Fed funds rate are tracked by the CME FedWatch tool, which shapes how many financial markets behave in anticipation of future Federal Reserve monetary policy decisions.
Author

Joaquin Monfort
FXStreet
Joaquin Monfort is a financial writer and analyst with over 10 years experience writing about financial markets and alt data. He holds a degree in Anthropology from London University and a Diploma in Technical analysis.