|

EUR/USD climbs above 1.0600 after mixed US data, as Fed’s minutes loom

  • November’s US JOLTs report exceeded estimates, and upward revisions to October’s report suggest the labor market remains tight.
  • US ISM Manufacturing PMI for December contracted for the second consecutive month.
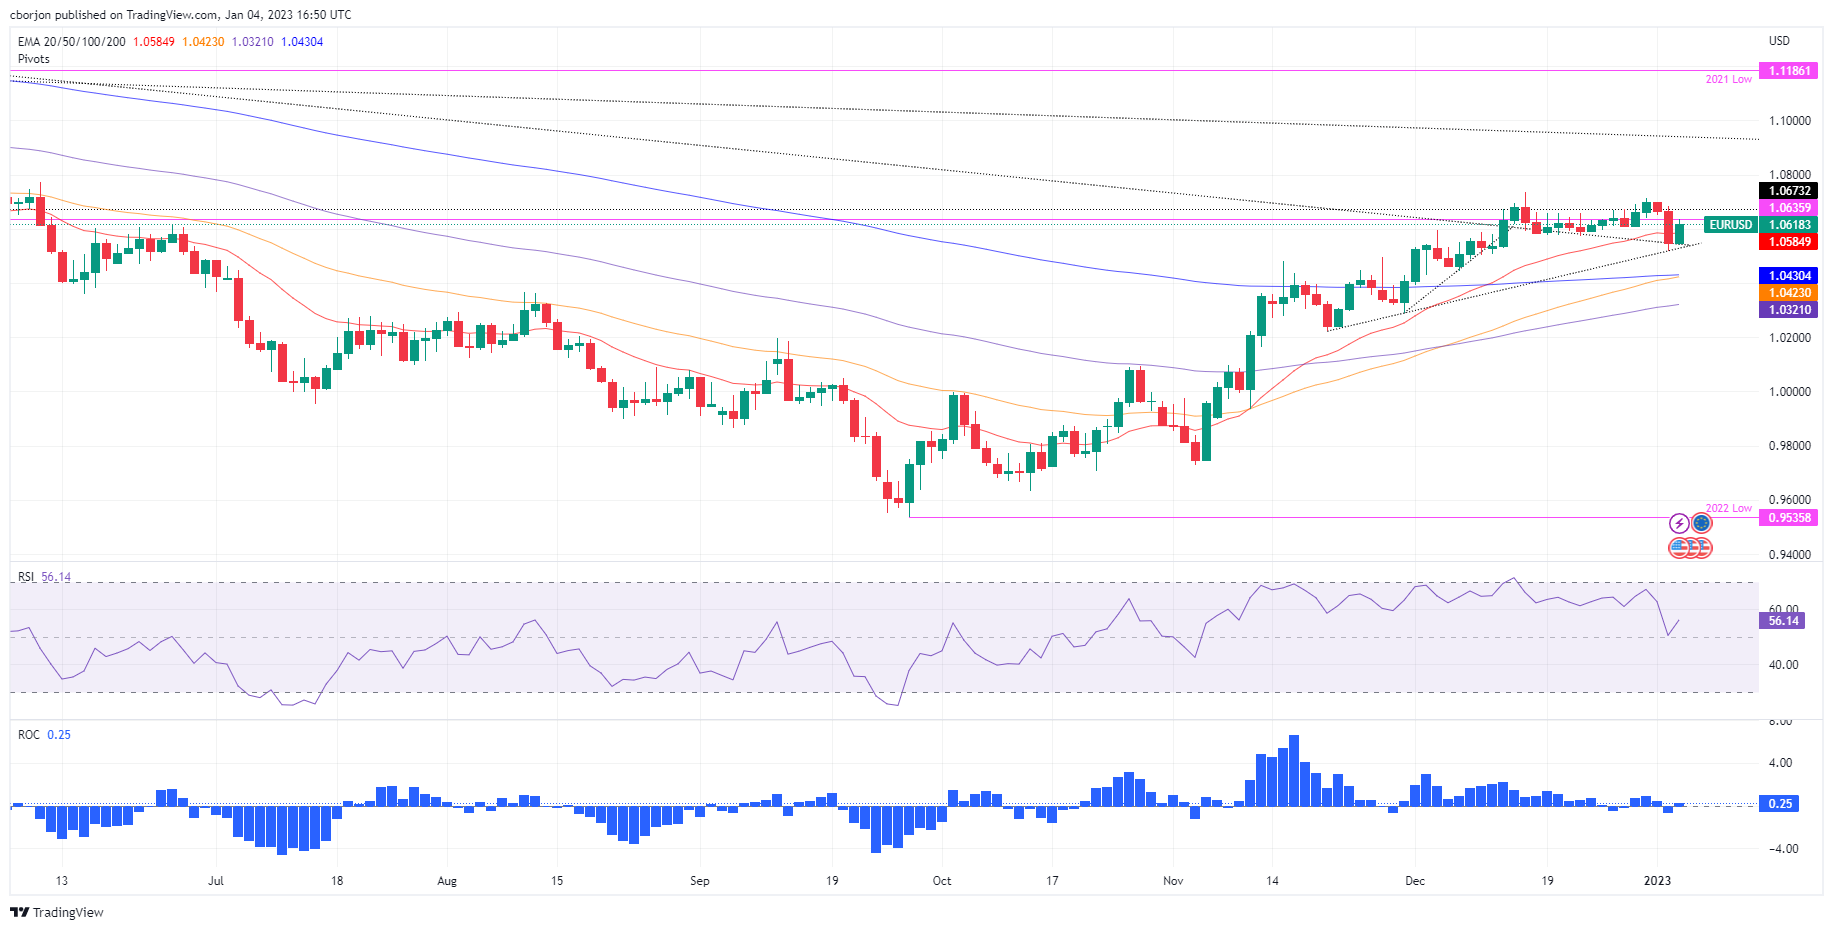
  • EUR/USD Price Analysis: Seesawing at around the 20-day EMA and the 1.0600 mark.

The Euro (EUR) retraces against the US Dollar (USD) after hitting daily highs of 1.0635 and is dropping after the release of mixed US economic data, slightly boosted the US Dollar and shifting sentiment sour. At the time of writing, the EUR/USD is trading at 1.0616, above its opening price by 0.66%.

The EUR/USD fell below 1.0600 after the release of US economic data. November’s JOLTs report showed that the labor market remains tight, coming at 10.458M  vs. 10.0M estimates, while October’s upward revision to 10.512M vs. 10.334M cemented the Federal Reserve’s (Fed) case for a 50 bps rate hike on February 1.

At the same time, the Institute for Supply Management (ISM) revealed the Manufacturing PMI index for December, which fell to 48.4, more than the 48.5 estimated by street analysts. Timothy R. Fiore, Chair of the ISM, noted, “The US manufacturing sector again contracted, with the Manufacturing PMI® at its lowest level since the coronavirus pandemic recovery began. With Business Survey Committee panelists reporting softening new order rates over the previous seven months, the December composite index reading reflects companies’ slowing their output.”

Delving into the sub-components of the report, the Employment Index rose by 51.4, returning into expansion, showing an improvement in the labor market, though pressuring the Federal Reserve for further action. The Production and Prices indices continued to ease, flashing the consumer’s shift toward services rather than goods.

Meanwhile, the US Dollar Index (DXY), a gauge of the buck’s value against a basket of six currencies, falls 0.41%, down to 104.258.

EUR/USD Price Analysis: Technical outlook

From a daily chart perspective, the EUR/USD remains neutral biased, seesawing around the 20-day Exponential Moving Average (EMA) at around 1.0583. Since today’s price action has failed to crack Tuesday’s high of 1.0683, the EUR/USD pair remains exposed to selling pressure. However, it should be said that the Relative Strength Index (RSI) bounced nearby the 50 mid-line, while the Rate of Change (RoC) is almost flat.

The EUR/USD key resistance levels are 1.0683, followed by the 1.0700 mark. On the flip side, the EUR/USD first support would be the 1.0600 mark, followed by the 20-day EMA at 1.0584 and the January 3 swing low of 1.0519.
EUR/USD

Overview
Today last price1.0613
Today Daily Change0.0061
Today Daily Change %0.58
Today daily open1.0552
 
Trends
Daily SMA201.0608
Daily SMA501.0375
Daily SMA1001.0135
Daily SMA2001.0321
 
Levels
Previous Daily High1.0684
Previous Daily Low1.052
Previous Weekly High1.0713
Previous Weekly Low1.0607
Previous Monthly High1.0736
Previous Monthly Low1.0393
Daily Fibonacci 38.2%1.0582
Daily Fibonacci 61.8%1.0621
Daily Pivot Point S11.0486
Daily Pivot Point S21.0421
Daily Pivot Point S31.0322
Daily Pivot Point R11.065
Daily Pivot Point R21.0749
Daily Pivot Point R31.0814

Author

Christian Borjon Valencia

Markets analyst, news editor, and trading instructor with over 14 years of experience across FX, commodities, US equity indices, and global macro markets.


More from Christian Borjon Valencia
Share:

Editor's Picks

GBP/USD off highs, back to 1.3620

GBP/USD remains slightly on the defensive at the end of the week, receding to the low 1.3600s after hitting fresh tops past 1.3670 earlier in the day. Cable’s correction comes after two daily gains in a row and amid a tepid advance in the Greenback, while poor UK data also accompany the downside.

EUR/USD treads water below 1.1700

EUR/USD now trades with modest losses around 1.1670 following another unsuccessful atempt to advance past 1.1700 the figure in a convincing fashion. The pair’s decline follows a maginal rebound in the US Dollar as market participants continue to assess recent US data as well as developments from the US bond market.

Gold keeps rallying toward $4,700, fresh three-month highs

Gold extends its last week's stellar performance into Asian trading on Monday, refreshing three-month highs beyond $4,600. The precious metal capitalizes on persistent US Dollar weakness, following the US Treasury's buyback plan amid fresh US-Canada trade tensions.

I thought newly launched meme coins were my ticket to wealth: Here's what actually happened
I’ve been trading cryptocurrencies for the past seven years, with meme coins becoming one of the most exciting and implacable parts of my experience. I love them because they represent internet culture and community sentiment, and, let’s be honest, extreme speculation. Newly launched meme coins were especially tempting: get in early enough, I thought, and a small bet could turn into a huge return.
US Dollar Weekly Forecast: Enter Jackson, mind the (budget) Hole
It was not geopolitics, the US-Japan joint FX intervention to support the beleaguered Japanese currency or the omnipresent bets on what the Federal Reserve (Fed) might do in the second half of the year that kept the US Dollar (USD) well on the back foot over the past five days.
$20 billion offered, $2 billion taken: Why Treasury doubled its buyback cap

The US Treasury moved off its own calendar on Wednesday, and that is the part worth sitting with. At 12:32 GMT, the department said it would at least double the size of liquidity support buyback operations in the 10-year to 20-year and 20-year to 30-year sectors, lifting the maximum from $2 billion per operation to at least $4 billion, effective September 9 and running to November 4.














