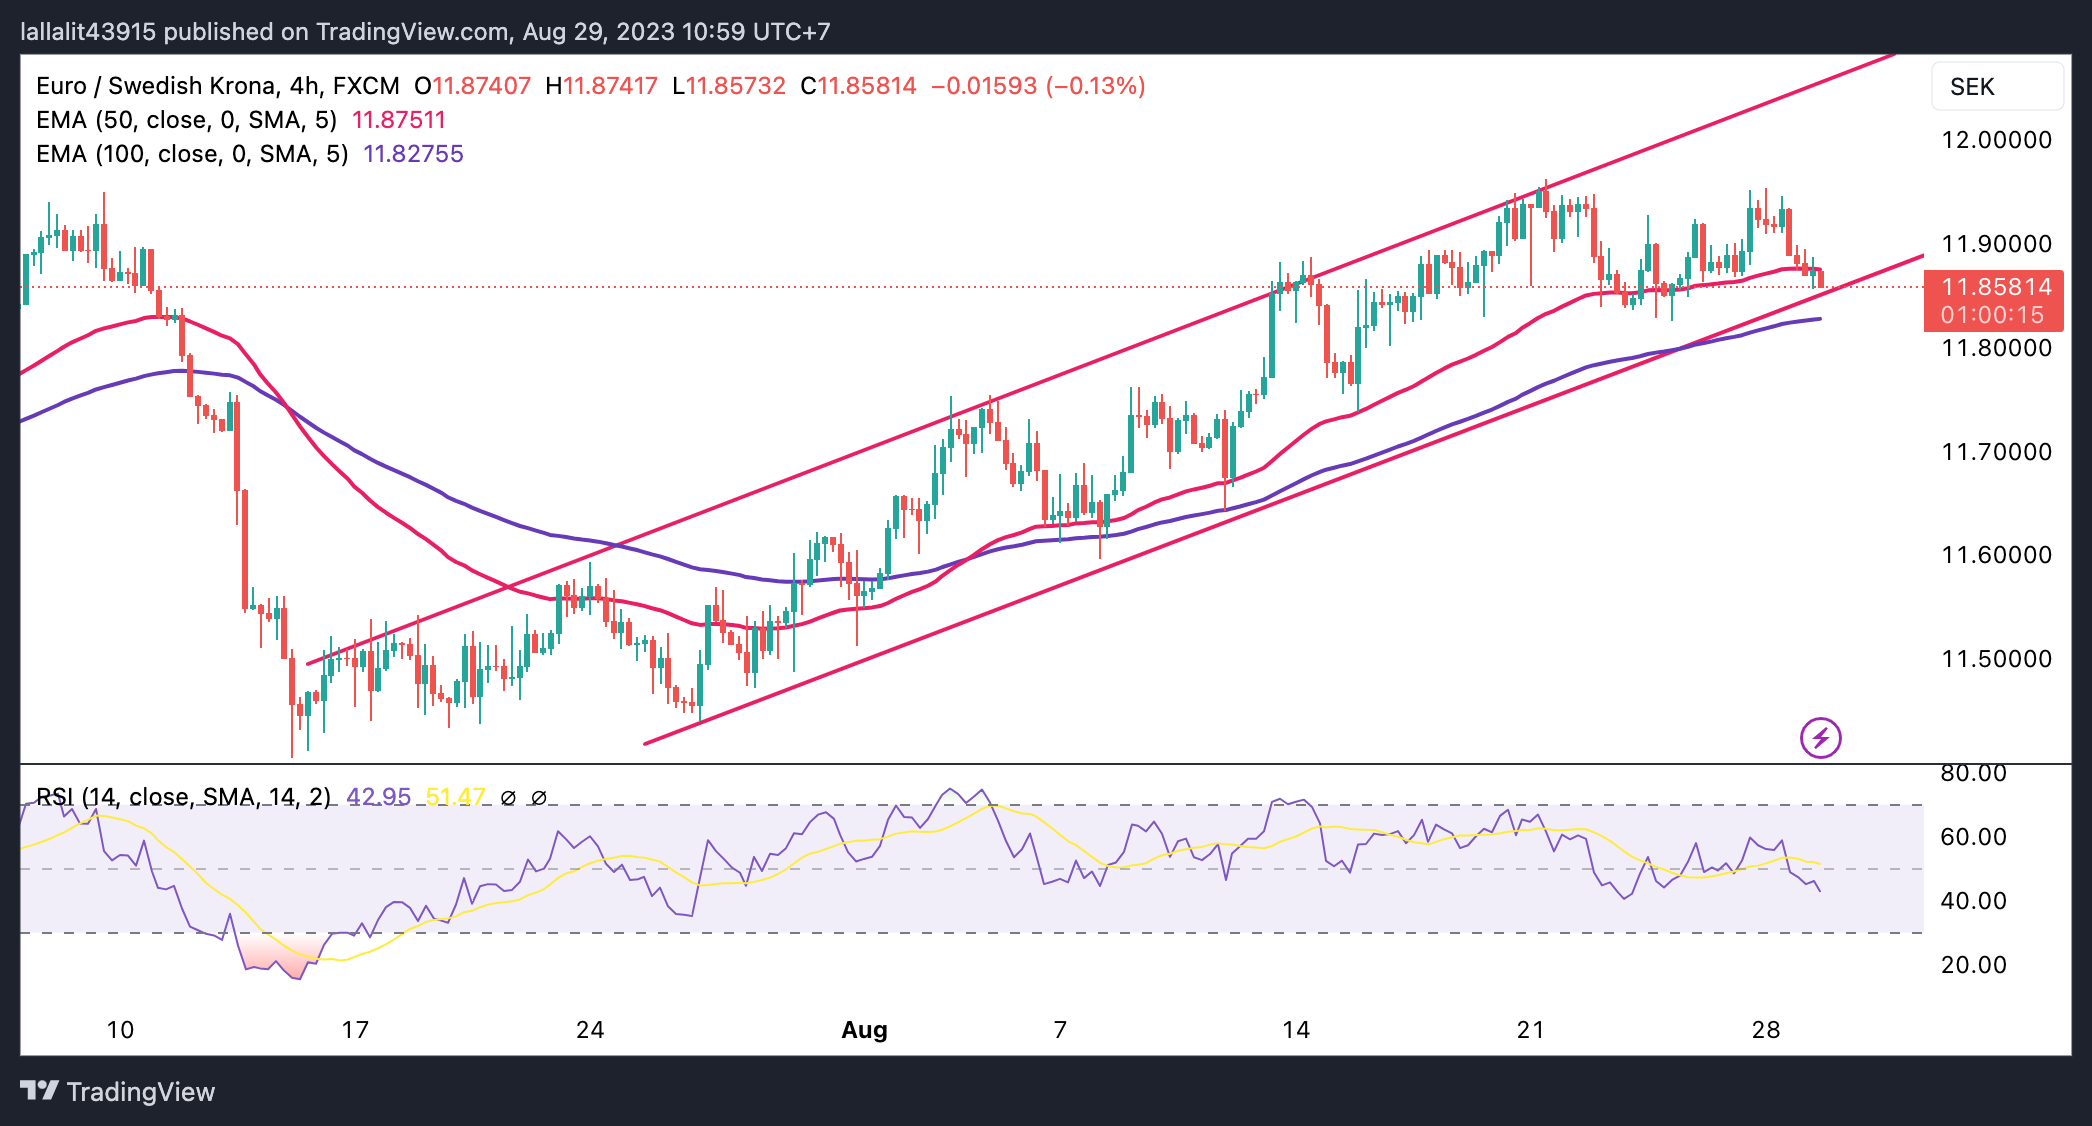
- EUR/SEK trades within the ascending trend-channel on the four-hour chart.
- The key support level is seen at 11.8550; 11.8752 acts as an immediate resistance level for the cross.
- The Relative Strength Index (RSI) stands in bearish territory below 50.
The EUR/SEK cross loses traction after retreating from a weekly high of 1.9455 during the Asian session on Tuesday. The cross currently trades near 11.8577, down 0.19% on the day.
From the technical perspective, EUR/SEK trades within the ascending trend-channel since the middle of July on the four-hour chart. Additionally, the cross holds above the key 100-hour Exponential Moving Average (EMA), which means the further upside looks favorable for the time being.
That said, the key support level for EUR/SEK is seen at 11.8550, representing the lower limit of the ascending trend-channel. A decisive break below the latter will see a drop to 11.8255 (a low of August 24). The next contention level will emerge at 11.8275 (100-hour EMA). The additional downside filter is located at 11.7375 (a low of August 15).
On the upside, the 50-hour EMA at 11.8752 acts as an immediate resistance level for the cross, en route to 11.9235 (a high of August 24). The next upside stop to watch is 11.9500 (a high of July 7). The key barrier for EUR/SEK is located at 11.9625, representing a Year-To-Date (YTD) high. Any meaningful follow-through buying above the latter will see a rally to the next critical area at 12.00. The mentioned level portrays a psychological round figure and the upper boundary of the ascending trend-channel.
It’s worth noting that the Relative Strength Index (RSI) stands in bearish territory below 50, indicating the path of least resistance seems lower for now.
EUR/SEK four-hour chart
Information on these pages contains forward-looking statements that involve risks and uncertainties. Markets and instruments profiled on this page are for informational purposes only and should not in any way come across as a recommendation to buy or sell in these assets. You should do your own thorough research before making any investment decisions. FXStreet does not in any way guarantee that this information is free from mistakes, errors, or material misstatements. It also does not guarantee that this information is of a timely nature. Investing in Open Markets involves a great deal of risk, including the loss of all or a portion of your investment, as well as emotional distress. All risks, losses and costs associated with investing, including total loss of principal, are your responsibility. The views and opinions expressed in this article are those of the authors and do not necessarily reflect the official policy or position of FXStreet nor its advertisers. The author will not be held responsible for information that is found at the end of links posted on this page.
If not otherwise explicitly mentioned in the body of the article, at the time of writing, the author has no position in any stock mentioned in this article and no business relationship with any company mentioned. The author has not received compensation for writing this article, other than from FXStreet.
FXStreet and the author do not provide personalized recommendations. The author makes no representations as to the accuracy, completeness, or suitability of this information. FXStreet and the author will not be liable for any errors, omissions or any losses, injuries or damages arising from this information and its display or use. Errors and omissions excepted.
The author and FXStreet are not registered investment advisors and nothing in this article is intended to be investment advice.
Recommended content
Editors’ Picks
EUR/USD clings to gains above 1.0750 after US data

EUR/USD manages to hold in positive territory above 1.0750 despite retreating from the fresh multi-week high it set above 1.0800 earlier in the day. The US Dollar struggles to find demand following the weaker-than-expected NFP data.
GBP/USD declines below 1.2550 following NFP-inspired upsurge

GBP/USD struggles to preserve its bullish momentum and trades below 1.2550 in the American session. Earlier in the day, the disappointing April jobs report from the US triggered a USD selloff and allowed the pair to reach multi-week highs above 1.2600.
Gold struggles to hold above $2,300 despite falling US yields

Gold stays on the back foot below $2,300 in the American session on Friday. The benchmark 10-year US Treasury bond yield stays in negative territory below 4.6% after weak US data but the improving risk mood doesn't allow XAU/USD to gain traction.
Bitcoin Weekly Forecast: Should you buy BTC here? Premium

Bitcoin (BTC) price shows signs of a potential reversal but lacks confirmation, which has divided the investor community into two – those who are buying the dips and those who are expecting a further correction.
Week ahead – BoE and RBA decisions headline a calm week

Bank of England meets on Thursday, unlikely to signal rate cuts. Reserve Bank of Australia could maintain a higher-for-longer stance. Elsewhere, Bank of Japan releases summary of opinions.