|

EUR/JPY Price Analysis: In consolidation hoovering around 131.60s

  • The shared currency began on the wrong foot the week, 0.05% down.
  • Risk-sentiment is off at the beginning of the week, as Russia-Ukraine talks stagnate.
  • EUR/JPY Price Forecast: Upward biased but in consolidating.

The common currency rally against the Japanese yen stalled on Monday, courtesy of risk-aversion in the financial markets spurred by the Russia-Ukraine peace talks unable to progress amid global central bank tightening. At 131.61, the EUR/JPY reflects the abovementioned, as the safe-haven yen appreciates.

Wall Street’s finished the day with losses between 0.04% and 1%. Meanwhile, in the FX space, the Loonie rallied against most G8 currencies, while the JPY slightly gained vs. the euro.

Overnight, the EUR/JPY was subdued in the 131.60 area, but in the European session, it jumped towards the 132.00 area, only to find more sellers, which pushed the pair to the 131.40s area.

EUR/JPY Price Forecast: Technical outlook
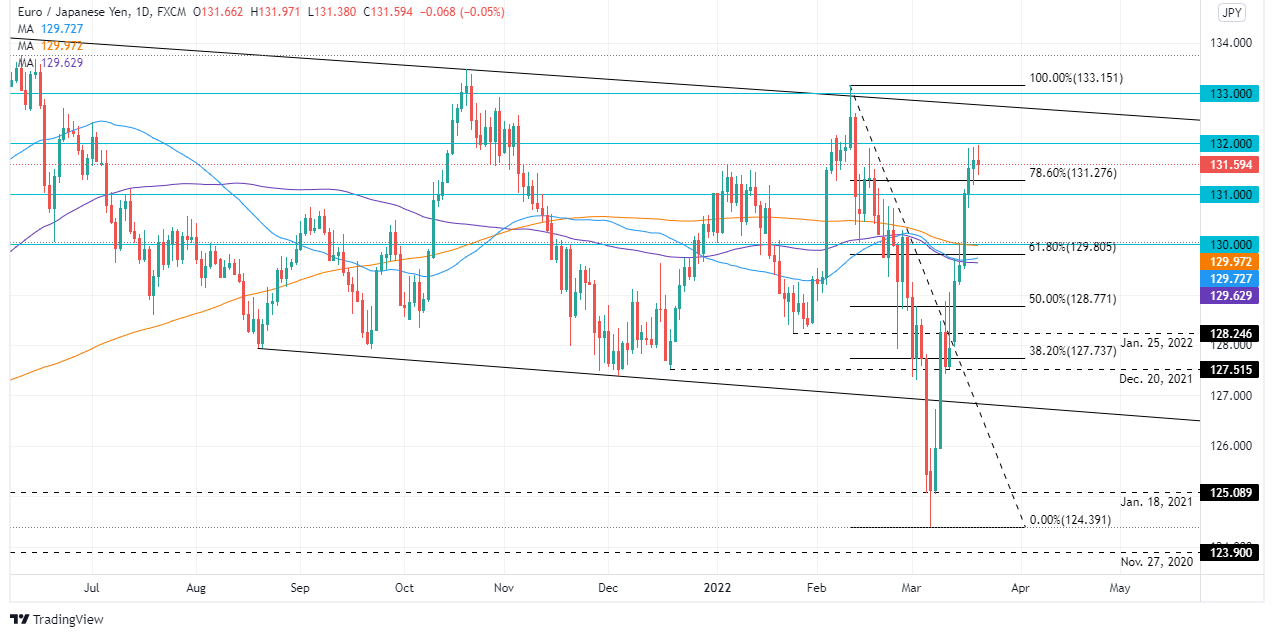
Daily chart

The EUR/JPY is upward biased, though it faced strong resistance at the 132.00 mark. However, the EUR/JPY might consolidate, as the 78.6% Fibonacci level lies just at 131.28, meaning that the pair might trade in a narrow range before resuming upwards.
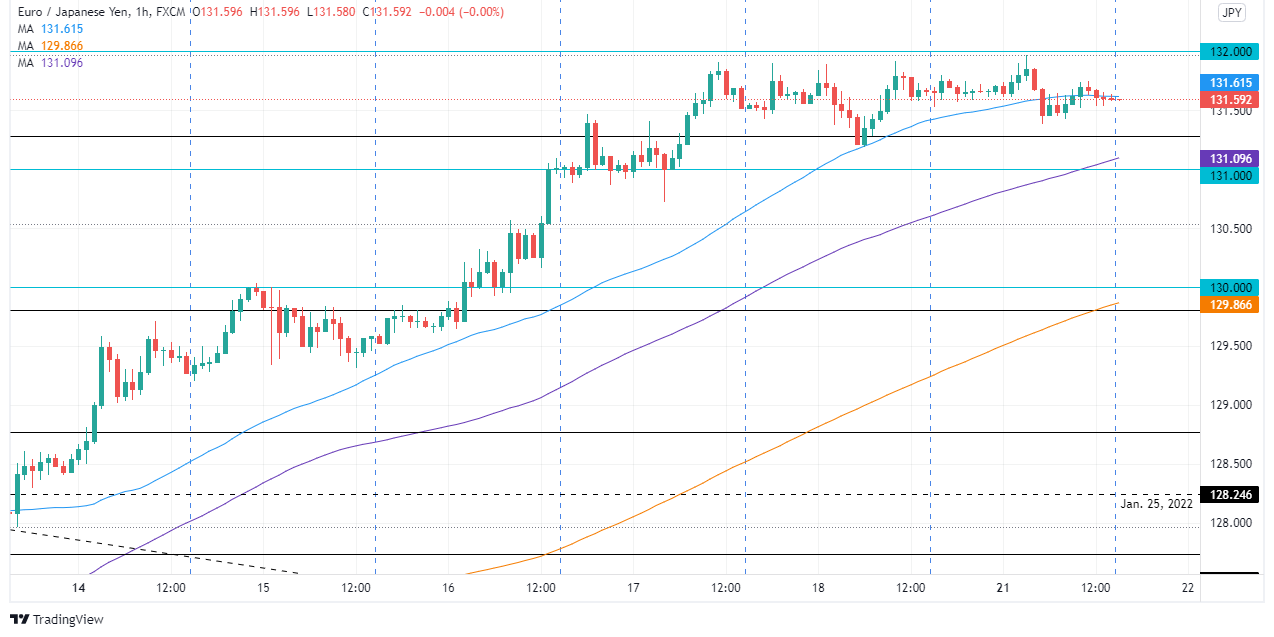
Hourly chart

The EUR/JPY 1-hour chart portrays the pair in consolidation, between the 131.00-132.00 range. Above the exchange rate lies the 50-simple moving average (SMA) at 131.61, while the 100 and the 200-SMA lie at 131.09 and 129.86, respectively. The EUR/JPY is upward biased, though downside risks remain.

If the cross-currency pair is going upwards, the first resistance would be the 50-SMA at 131.61. Breach of the latter would expose 132.00, followed by 132.50. On the flip side, the EUR/JPY first support would be the 78.6% Fibonacci level at 131.28. Once cleared, the next support could be the 100-SMA at 131.09, followed by the 131.00 mark. A sustained break would expose the area of the 200-SMA at 129.86 and the 130.00 mark.

EUR/JPY

Overview
Today last price131.61
Today Daily Change-0.10
Today Daily Change %-0.08
Today daily open131.71
 
Trends
Daily SMA20128.82
Daily SMA50129.73
Daily SMA100129.66
Daily SMA200130.02
 
Levels
Previous Daily High131.92
Previous Daily Low131.19
Previous Weekly High131.92
Previous Weekly Low127.98
Previous Monthly High133.15
Previous Monthly Low127.92
Daily Fibonacci 38.2%131.64
Daily Fibonacci 61.8%131.47
Daily Pivot Point S1131.3
Daily Pivot Point S2130.88
Daily Pivot Point S3130.56
Daily Pivot Point R1132.03
Daily Pivot Point R2132.34
Daily Pivot Point R3132.76

Author

Christian Borjon Valencia

Markets analyst, news editor, and trading instructor with over 14 years of experience across FX, commodities, US equity indices, and global macro markets.

More from Christian Borjon Valencia
Share:

Editor's Picks

EUR/USD eyes nine-day EMA barrier after rebounding from 1.1600

EUR/USD gains ground after registering modest losses in the previous session, trading around 1.1620 during the Asian hours on Friday. The technical analysis of the daily chart suggests an ongoing bearish bias as the pair remains within the descending channel pattern.

GBP/USD: Pound Sterling ticks up against US Dollar in countdown to US NFP

The Pound Sterling trades marginally higher to near 1.3365 against the US Dollar during the Asian trading session on Friday. The GBP/USD pair edges up as the US Dollar ticks down ahead of the United States Nonfarm Payrolls data for February, which will be published at 13:30 GMT.

Gold rises but remains on track for weekly loss in five weeks

Gold price recovers its recent losses from the previous session on Friday. The yellow metal advances as the broader precious metals market rebounds on safe-haven demand. However, the yellow metal is on track for its first weekly decline in five weeks as escalating Middle East tensions push oil prices higher, fueling inflation concerns and reducing bets on Federal Reserve rate cuts.

Bitcoin, Ethereum and Ripple at risk as US-Iran war extends

Bitcoin, Ethereum, and Ripple trade cautiously at press time on Friday, close to key support levels after a roughly 2% pullback the previous day. Bitcoin holds above $71,000, Ethereum at $2,000, and XRP continues to consolidate in a sideways range.

The market compass is pointing at a barrel of Oil

The Asian open is arriving with equities leaning the wrong way, and the reason is not complicated. The market’s compass needle has snapped firmly toward crude. In this tape, oil is not just another input price; it is the gravitational center around which every asset class is orbiting.

Ripple tests recovery strength amid steady ETF inflows, growing retail interest

Ripple (XRP) continues to demonstrate notable resilience as the cryptocurrency market navigates the persistent war in the Middle East after the United States (US) and Israel attacked Iran on Saturday.