|

EUR/JPY Price Analysis: Experiences minor pullback below 156.00, but uptrend remains in play

  • EUR/JPY registers losses below the 156.00 area due to mixed market sentiment, but the overall uptrend remains.
  • The bearish-harami candlestick pattern suggests a potential pullback while maintaining the upward bias.
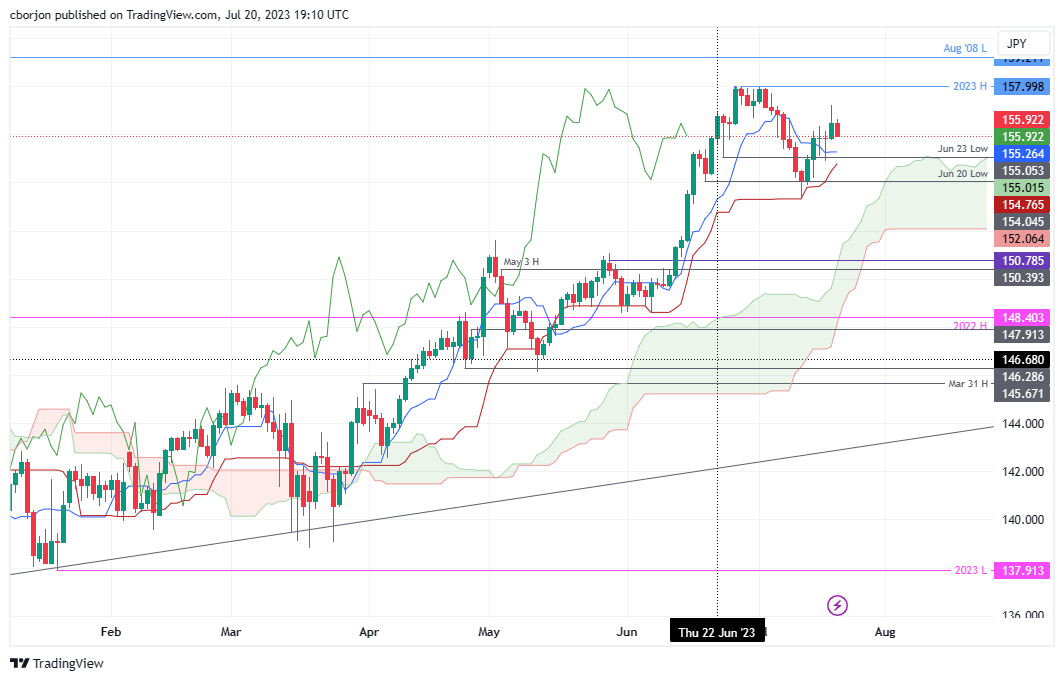
  • EUR/JPY’s key support levels are the Tenkan-Sen line at 155.26, the Senkou Span A at 155.01, and the Kijun-Sen levels at 154.76.
  • For buyers to regain control, EUR/JPY must not achieve a daily close below 156.00. Resistance levels lie at the July 19 high of 157.20, and (YTD) high at 157.99.

Late in the North American session, the EUR/JPY registered losses below the 156.00 area amid a mixed market sentiment triggered by upbeat US economic data, underpinning safe-haven currencies in the FX space. At the time of writing, the EUR/JPY exchanges hand at 155.99, after hitting a daily high of 156.62.

EUR/JPY Price Analysis: Technical outlook

The EUR/JPY uptrend remains in play, but today’s price action, coupled with Wednesday, is forming a two-candlestick chart pattern called ‘bearish-harami,’ which suggests the EUR/JPY could be ready for a pullback while maintaining its upward bias.

It should be said that on the EUR/JPY way down, the Tenkan-Sen would be the first support at 155.26. A breach of the latter will expose the Senkou Span A at 155.01, followed by the Kijun-Sen levels emerging at 154.76.

On the flip side, for EUR/JPY buyers to regain control, they must keep prices from achieving a daily close below 156.00. Once done, buyers could remain hopeful for higher prices, with the first resistance being the July 19 high at 157.20, followed by the year-to-date (YTD) high at 157.99.

EUR/JPY Price Action – Daily chart

EUR/JPY Daily chart

EUR/JPY

Overview
Today last price156
Today Daily Change-0.37
Today Daily Change %-0.24
Today daily open156.37
 
Trends
Daily SMA20156.41
Daily SMA50152.81
Daily SMA100149.06
Daily SMA200146.13
 
Levels
Previous Daily High157.21
Previous Daily Low155.84
Previous Weekly High156.67
Previous Weekly Low153.43
Previous Monthly High158
Previous Monthly Low148.62
Daily Fibonacci 38.2%156.68
Daily Fibonacci 61.8%156.36
Daily Pivot Point S1155.74
Daily Pivot Point S2155.11
Daily Pivot Point S3154.38
Daily Pivot Point R1157.1
Daily Pivot Point R2157.84
Daily Pivot Point R3158.46

Author

Christian Borjon Valencia

Markets analyst, news editor, and trading instructor with over 14 years of experience across FX, commodities, US equity indices, and global macro markets.

More from Christian Borjon Valencia
Share:

Editor's Picks

EUR/USD stays weak near 1.1850 after dismal German ZEW data

EUR/USD remains in the red near 1.1850 in the European session on Tuesday. A broad US Dollar bullish consolidation combined with a softer risk tone keep the pair undermined alongside downbeat German ZEW sentiment readings for February. 

GBP/USD holds losees near 1.3600 after weak UK jobs report

GBP/USD is holding moderate losses near the 1.3600 level in Tuesday's European trading. The United Kingdom employment data suggested worsening labor market conditions, bolstering bets for a BoE interest rate cut next month. This narrative keeps the Pound Sterling under bearish pressure. 

Gold pares intraday losses; keeps the red above $4,900 amid receding safe-haven demand

Gold (XAU/USD) attracts some follow-through selling for the second straight day and dives to over a one-week low, around the $4,858 area, heading into the European session on Tuesday. 

Canada CPI expected to show sticky inflation in January, still above BoC’s target

Economists see the headline CPI rising by 2.4% in a year to January, still above the BoC’s target and matching December’s increase. On a monthly basis, prices are expected to rise by 0.1%.

UK jobs market weakens, bolstering rate cut hopes

In the UK, the latest jobs report made for difficult reading. Nonetheless, this represents yet another reminder for the Bank of England that they need to act swiftly given the collapse in inflation expected over the coming months. 

Stellar mixed sentiment caps recovery

Stellar price remains under pressure, trading at $0.170 on Tuesday after failing to close above the key resistance on Sunday. The derivatives metric supports the bearish sentiment, with XLM’s short bets rising among traders and funding rates turning negative.