• The EUR/JPY cut last Friday’s gains, dropping towards the 200-day EMA, as sellers target 140.00 and below.
  • EUR/JPY Price Analysis: The pullback towards the 200-DMA might pave the way for a deeper correction before resuming the uptrend.

EUR/JPY continued to trade lower for two consecutive days, retracing most of last Friday’s gains, and reclaimed the 50 and 20-day Exponential Moving Averages (EMAs), on its way south. The Euro’s (EUR) collapse was capped by the trend-setter 200-day EMA at 140.30, though it would likely remain under pressure. At the time of writing, the EUR/JPY is trading at 140.52, with losses of 1.20%, as Tuesday’s session ends.

EUR/JPY Price Analysis: Technical outlook

The EUR/JPY shifted to neutral from neutral-upwards, according to the daily chart, following Tuesday’s fall beneath essential demand zones. In addition, the EUR/JPY pair could turn neutral downwards as the spot price hovers nearby the 200-day EMA, which, once cleared, could pave the way for further losses.

The Relative Strength Index (RSI) and the Rate of Change (RoC) supported the above-mentioned scenario, meaning that in the short term, the EUR/JPY might pull back before resuming its uptrend.

Therefore, the EUR/JPY first support would be the 200-day EMA at 140.30. A breach of the latter will send the pair sliding towards the 140.00 figure, which, once cleared, the EUR/JPY might fall toward the January 20 daily low of 139.03.

As an alternate scenario and the current trend, the EUR/JPY first resistance would be the 20-day EMA at 141.03. A break of that supply zone and the EUR/JPY might rally toward the psychological 142.00 area followed by the February 7 high fo 142.33.

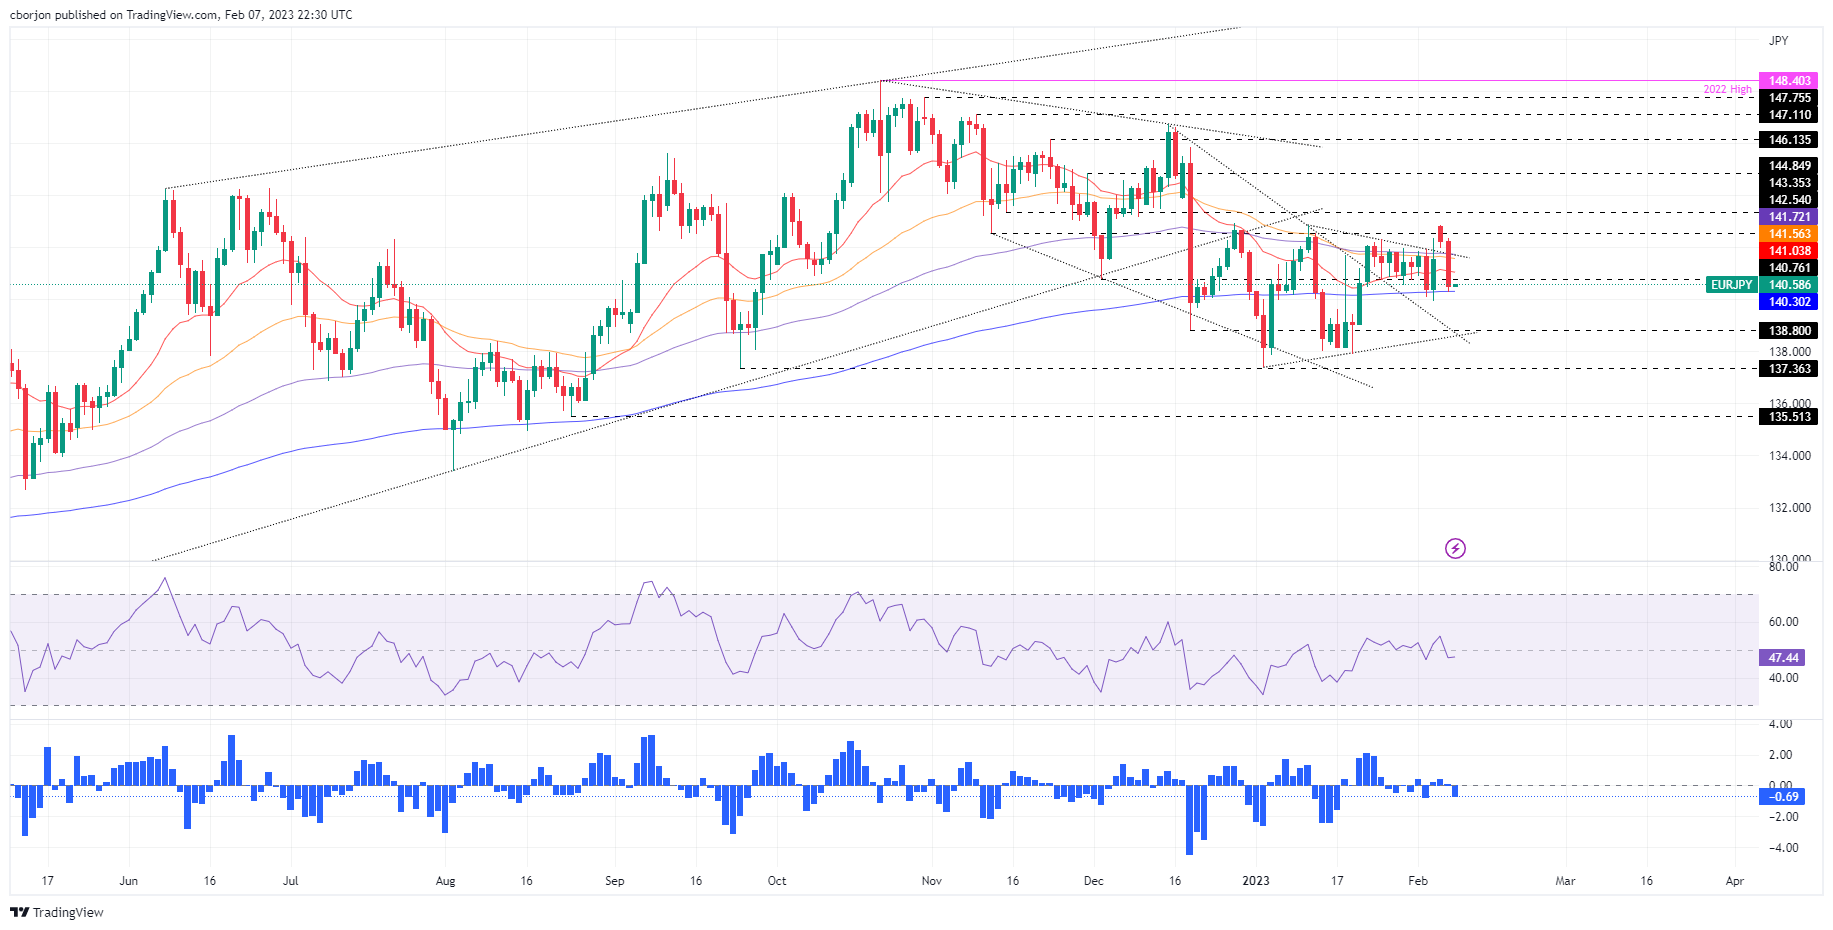
EUR/JPY Key Technical Levels

EUR/JPY

Overview
Today last price 140.56
Today Daily Change -1.74
Today Daily Change % -1.22
Today daily open 142.3
 
Trends
Daily SMA20 140.83
Daily SMA50 141.73
Daily SMA100 142.97
Daily SMA200 141.01
 
Levels
Previous Daily High 142.88
Previous Daily Low 141.59
Previous Weekly High 142.34
Previous Weekly Low 139.93
Previous Monthly High 142.86
Previous Monthly Low 137.39
Daily Fibonacci 38.2% 142.39
Daily Fibonacci 61.8% 142.08
Daily Pivot Point S1 141.63
Daily Pivot Point S2 140.97
Daily Pivot Point S3 140.35
Daily Pivot Point R1 142.92
Daily Pivot Point R2 143.54
Daily Pivot Point R3 144.2


Share: Feed news

Information on these pages contains forward-looking statements that involve risks and uncertainties. Markets and instruments profiled on this page are for informational purposes only and should not in any way come across as a recommendation to buy or sell in these assets. You should do your own thorough research before making any investment decisions. FXStreet does not in any way guarantee that this information is free from mistakes, errors, or material misstatements. It also does not guarantee that this information is of a timely nature. Investing in Open Markets involves a great deal of risk, including the loss of all or a portion of your investment, as well as emotional distress. All risks, losses and costs associated with investing, including total loss of principal, are your responsibility. The views and opinions expressed in this article are those of the authors and do not necessarily reflect the official policy or position of FXStreet nor its advertisers. The author will not be held responsible for information that is found at the end of links posted on this page.

If not otherwise explicitly mentioned in the body of the article, at the time of writing, the author has no position in any stock mentioned in this article and no business relationship with any company mentioned. The author has not received compensation for writing this article, other than from FXStreet.

FXStreet and the author do not provide personalized recommendations. The author makes no representations as to the accuracy, completeness, or suitability of this information. FXStreet and the author will not be liable for any errors, omissions or any losses, injuries or damages arising from this information and its display or use. Errors and omissions excepted.

The author and FXStreet are not registered investment advisors and nothing in this article is intended to be investment advice.

Recommended content


Recommended content

Editors’ Picks

EUR/USD holds below 1.0750 ahead of key US data

EUR/USD holds below 1.0750 ahead of key US data

EUR/USD trades in a tight range below 1.0750 in the European session on Friday. The US Dollar struggles to gather strength ahead of key PCE Price Index data, the Fed's preferred gauge of inflation, and helps the pair hold its ground. 

EUR/USD News

USD/JPY stays firm above 156.00 after BoJ Governor Ueda's comments

USD/JPY stays firm above 156.00 after BoJ Governor Ueda's comments

USD/JPY stays firm above 156.00 after surging above this level on the Bank of Japan's decision to leave the policy settings unchanged. BoJ Governor said weak Yen was not impacting prices but added that they will watch FX developments closely.

USD/JPY News

Gold price oscillates in a range as the focus remains glued to the US PCE Price Index

Gold price oscillates in a range as the focus remains glued to the US PCE Price Index

Gold price struggles to attract any meaningful buyers amid the emergence of fresh USD buying. Bets that the Fed will keep rates higher for longer amid sticky inflation help revive the USD demand.

Gold News

Bitcoin Weekly Forecast: BTC’s next breakout could propel it to $80,000 Premium

Bitcoin Weekly Forecast: BTC’s next breakout could propel it to $80,000

Bitcoin’s recent price consolidation could be nearing its end as technical indicators and on-chain metrics suggest a potential upward breakout. However, this move would not be straightforward and could punish impatient investors. 

Read more

US core PCE inflation set to signal firm price pressures as markets delay Federal Reserve rate cut bets

US core PCE inflation set to signal firm price pressures as markets delay Federal Reserve rate cut bets

The core PCE Price Index, which excludes volatile food and energy prices, is seen as the more influential measure of inflation in terms of Fed positioning. The index is forecast to rise 0.3% on a monthly basis in March, matching February’s increase. 

Read more

Forex MAJORS

Cryptocurrencies

Signatures