|

EUR/JPY Price Analysis: Climbs above 147.00, refreshing 8-year highs, as buyers target 150.00

  • EUR/JPY printed a fresh YTD high above 147.00 as buyers eye December’s 2014 high.
  • A risk-on impulse keeps safe-haven currencies, like the yen, on the defensive.
  • EUR/JPY Price Analysis: Negative divergence in the daily and hourly charts to pave the way for a correction towards 145.00.

The EUR/JPY continues extending its gains, eyeing December’s 2013 high of 149.78, while the Japanese yen continues to weaken, despite further verbal interventions by Japanese authorities, which have failed to move the markets in favor of the battered yen. At the time of writing, the EUR/JPY is trading at 147.04. shy of the YTD high of 147.12.

Sentiment-wise, investors’ mood is upbeat, as portrayed by European bourses closing in the green, while US stocks followed suit. Therefore, safe-haven currencies like the Japanese yen, and the Swiss franc, would remain the weakest links in favor of other G8 currencies.

EUR/JPY Price Analysis

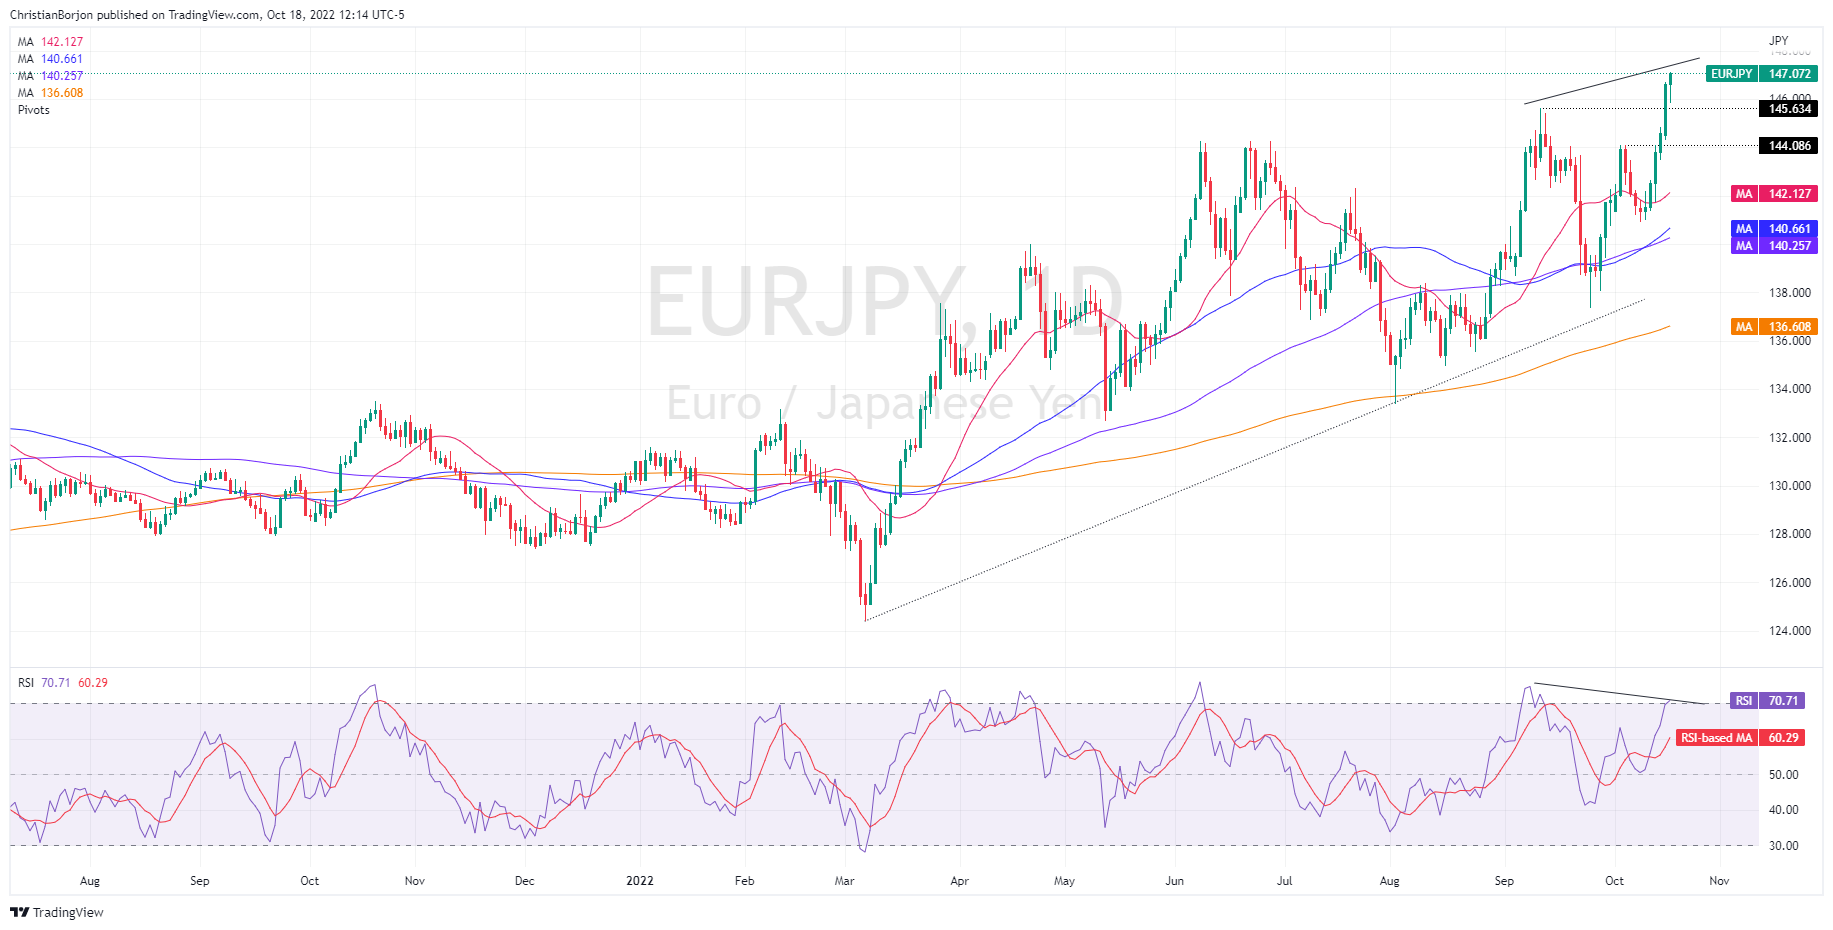
The daily chart shows that the EUR/JPY is upward biased. On Monday, the cross-currency pair broke into fresh eight-year highs and, earlier in the North American session, reached a YTD high at 147.12. Of note is that as the EUR/JPY climbs, registering higher highs, the Relative Strength Index (RSI) didn’t, so a negative divergence between RSI and price action could pave the way for a mean-reversion move before continuing to rally.

Hence, the EUR/JPY first support would be the September 12 daily high at 145.63. Break below will expose the October 5 cycle high-turned-support at 144.08, ahead of the 20-day EMA at 142.12.

EUR/JPY Daily chart

In the near term, the EUR/JPY one-hour chart shows price action as overextended, registering higher highs, while the RSI prints lower highs, as in the daily chart. Therefore, a negative divergence surfaced, opening the door for a correction.

Therefore, the EUR/JPY first support would be the 20-EMA at 14.70, which, once cleared, would expose a busy area, with the confluence of the daily low, the 50-EMA, and the central pivot point at around 145.84. A breach of the latter will expose the S1 pivot at around 145.00.

EUR/JPY Hourly chart

EUR/JPY Key Technical Levels

EUR/JPY

Overview
Today last price147.04
Today Daily Change0.36
Today Daily Change %0.25
Today daily open146.68
 
Trends
Daily SMA20141.99
Daily SMA50140.52
Daily SMA100140.21
Daily SMA200136.56
 
Levels
Previous Daily High146.72
Previous Daily Low144.37
Previous Weekly High144.85
Previous Weekly Low140.9
Previous Monthly High145.64
Previous Monthly Low137.38
Daily Fibonacci 38.2%145.82
Daily Fibonacci 61.8%145.27
Daily Pivot Point S1145.13
Daily Pivot Point S2143.57
Daily Pivot Point S3142.77
Daily Pivot Point R1147.48
Daily Pivot Point R2148.28
Daily Pivot Point R3149.83

Author

Christian Borjon Valencia

Markets analyst, news editor, and trading instructor with over 14 years of experience across FX, commodities, US equity indices, and global macro markets.

More from Christian Borjon Valencia
Share:

Editor's Picks

GBP/USD climbs to four-day highs near 1.3250

GBP/USD rapidly reverses Friday’s small losses and challenges the 1.3250 level, or four-day tops, at the beginning of the week. Cable’s upside comes on the back of further loss of momentum in the Greenback, while traders continue to assess the geopolitical front and upcoming key events.

EUR/USD extends the advance past 1.1400

EUR/USD starts the week on a positive note, trading above 1.1400 on Monday as broad-based US Dollar weakness lends support to the pair. In the meantime, investors continue to monitor developments surrounding efforts to end the US-Iran conflict, while attention gradually shifts to the ECB's annual forum and the US NFP data.

Gold falters just ahead of $4,100

Gold remains under modest bearish pressure just above the key $4,000 mark per troy ounce on Monday. The yellow metal struggles to extend its recent gains as renewed effervescence in the Middle East revives inflation concerns and bolsters Fed rate hike expectations.

Bitcoin four-year cycle: BTC risks 75% drawdown with four months of bear market still ahead

Bitcoin price continues to trend downward below the $60,000 support zone after losing over 50% of its value since the $126,199 high in October. Bitcoin’s four-year cycle, measured from cycle tops to bottoms, suggests that four months of a bear market are still ahead.

Just like Fed, is BoJ’s independence under threat?

When talking about central bank independence, most of the focus has been on Donald Trump’s pressure on the Federal Reserve. But a similar story, a quieter one for now, seems to be happening on the other side of the Pacific: Japan’s government may be testing the Bank of Japan’s independence.

Kevin Warsh isn't expected to say much in Sintra: That's exactly why markets will listen

Financial markets could find an important catalyst in the enchanting, fairytale-like landscape of Sintra this week. The ECB Forum will, as it does every year, gather the crème de la crème of central banks. The new boss at the Fed, who has clearly said that the Fed should stop explaining everything, will need to talk – and traders should listen.