|

EUR/JPY Price Analysis: Clashes strong support, around 157.50 as bears loom

  • EUR/JPY is diving almost 3% since November 27, when the pair hit a high of 163.72
  • The downtrend remains intact, though it could accelerate further with a drop below 157.55.
  • If EUR/JPY buyers reclaim 159.00, that could pave the way for gains.

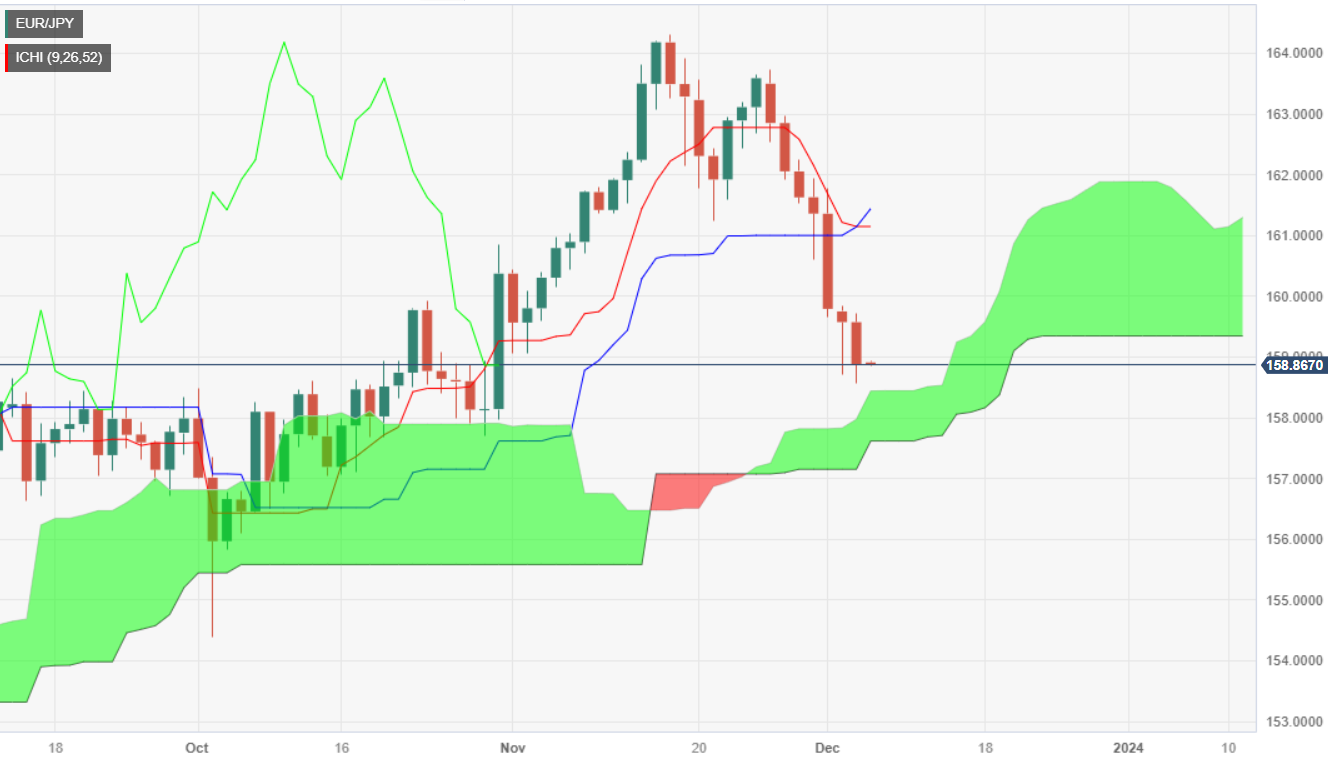
The EUR/JPY extends its losses for the seventh straight day and hovers just above the top of the Ichimoku Cloud (Kumo), at around 158.89, down by 0.36% daily after reaching a daily high of 159.71. The main drivers behind the move have been market sentiment shifting sour, favoring appetite for the safe-haven status of the Japanese Yen (JPY), which appreciated against most G8 FX currencies, except for the Greenback.

EUR/JPY downtrend remains intact even though it bottomed at around 158.50s, which could open the door for some consolidation as bears take a respite. Nevertheless, the crossing of the Tenkan-Sen below the Kijun-Sen, along with the Chikou Span shifting bearish, means the Euro (EUR) is not out of the woods.

Given the backdrop, the EUR/JPY first support is the top of the Kumo at around 158.40/50. A decisive break could drag prices toward the bottom of the Kumo at 157.55, which, once taken out, would cement the pair’s bearish bias. The next demand area would be a support trendline at around 157.00, followed by the October 3 swing low of 154.34.

On the other hand, if buyers reclaim 159.00, that could pave the way for a recovery toward the confluence of the Senkou Span A, and the Tenkan and Kijun-Sen at around 161.13/20.

EUR/JPY Price Analysis – Daily Chart
EUR/JPY Technical Levels

EUR/JPY

Overview
Today last price158.89
Today Daily Change-0.68
Today Daily Change %-0.43
Today daily open159.57
 
Trends
Daily SMA20162.19
Daily SMA50159.82
Daily SMA100158.68
Daily SMA200153.76
 
Levels
Previous Daily High159.84
Previous Daily Low158.71
Previous Weekly High163.72
Previous Weekly Low159.65
Previous Monthly High164.31
Previous Monthly Low159.07
Daily Fibonacci 38.2%159.15
Daily Fibonacci 61.8%159.41
Daily Pivot Point S1158.91
Daily Pivot Point S2158.25
Daily Pivot Point S3157.78
Daily Pivot Point R1160.04
Daily Pivot Point R2160.51
Daily Pivot Point R3161.17

Author

Christian Borjon Valencia

Markets analyst, news editor, and trading instructor with over 14 years of experience across FX, commodities, US equity indices, and global macro markets.


More from Christian Borjon Valencia
Share:

Editor's Picks

AUD/USD battles 0.7000 amid bullish USD

AUD/USD keeps its offered tone intact near 0.7000 at the start of a new week, trading near its lowest level since August 4 amid a bullish US Dollar. US yields hold near multi-year highs amid inflation risks from higher oil prices and rising bets on an October Fed rate hike. This, along with the US-Iran standoff, continues to underpin the safe-haven buck and weigh on the pair ahead of Tuesday's RBA policy announcements.

USD/JPY climbs back to 157.75 after BoJ minutes amid firm USD

USD/JPY attracts some dip-buyers at the start of a new week, reversing part of Friday's slide driven by speculation that authorities will step in again to prop up the Japanese Yen. However, the BoJ's relative dovish-leaning tone caps the JPY. Meanwhile, the US Dollar regains traction as the US-Iran standoff supports crude oil prices, fueling inflation fears and reaffirming bets for an October Fed rate hike. This further support the pair.

Gold slides to $4,200 on Fed hike bets and Iran risks

Gold falls hard at the start of a new week, sliding back closer to $4,200 and the lower boundary of the monthly range. Firming October Fed rate-hike bets, along with oil-driven inflation risks, keep US bond yields elevated near multi-year highs, helping the US Dollar regain positive traction amid persistent Iran risks. These factors weigh heavily on the bullion.

Week ahead: Rate hike bets face a crucial data week
Despite the solid drop from the mid-September high, oil prices remained in the driver’s seat for another week, setting the tone in financial markets. Six months have passed since the late-February start of the US-Iran conflict, and there is still no breakthrough in the stalled talks, despite pressure from regional leaders and the rest of the world.
After the Trump Xi summit, markets are trading three clocks
The summit delivered time, not a deal. Trade, oil and chips now each run to a date, and the macro backdrop matters more than the pageantry. Markets wanted a deal and got a calendar date instead. Xi Jinping left Washington on Friday after tea at the White House and a tour of the National Archives.
Fed vs BoJ: Both hiked. The market only believes one of them – and the chart shows which

The Fed and the BoJ have just done something remarkably similar. Both central banks raised interest rates by 25 bps last week, both are confronting inflation risks, and both signal that future decisions will depend on incoming economic data.