- RSI on the daily chart for EUR/JPY reveals growing buying momentum, while contrasting MACD may suggest a steady bearish sentiment.
- The hourly RSI near overbought condition may signal that the pair may consolidate in the next hours.
The EUR/JPY pair is seen holding comfortable grounds at 161.83, marking a gain of 0.31%. On the shorter timeframes indicators gained significant ground and are near overbought territory which could mean the pair might consolidate in the next hours. Overall, the outlook remains bullish but the buyers must regain the 20-day Simple Moving Average (SMA) to make the short-term outlook more positive.
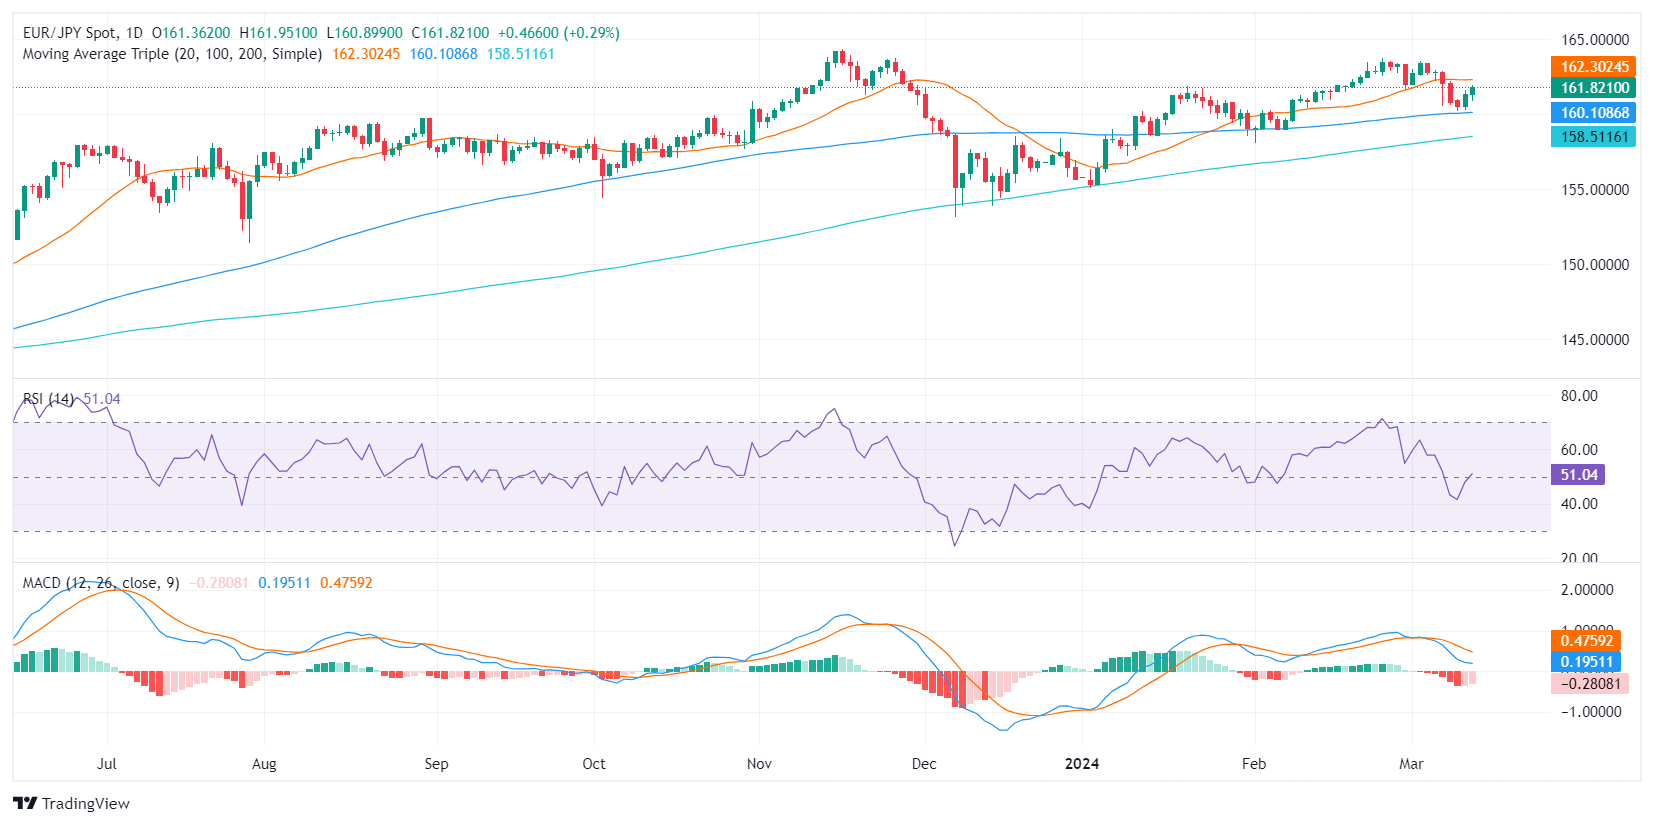
On the daily chart for EUR/JPY, the Relative Strength Index (RSI) is showing a positive trend. It has increased from negative to positive territory, signaling stronger buying momentum. However, the decreasing red bars of the Moving Average Convergence Divergence (MACD) imply bearish but less intense momentum.
EUR/JPY daily chart
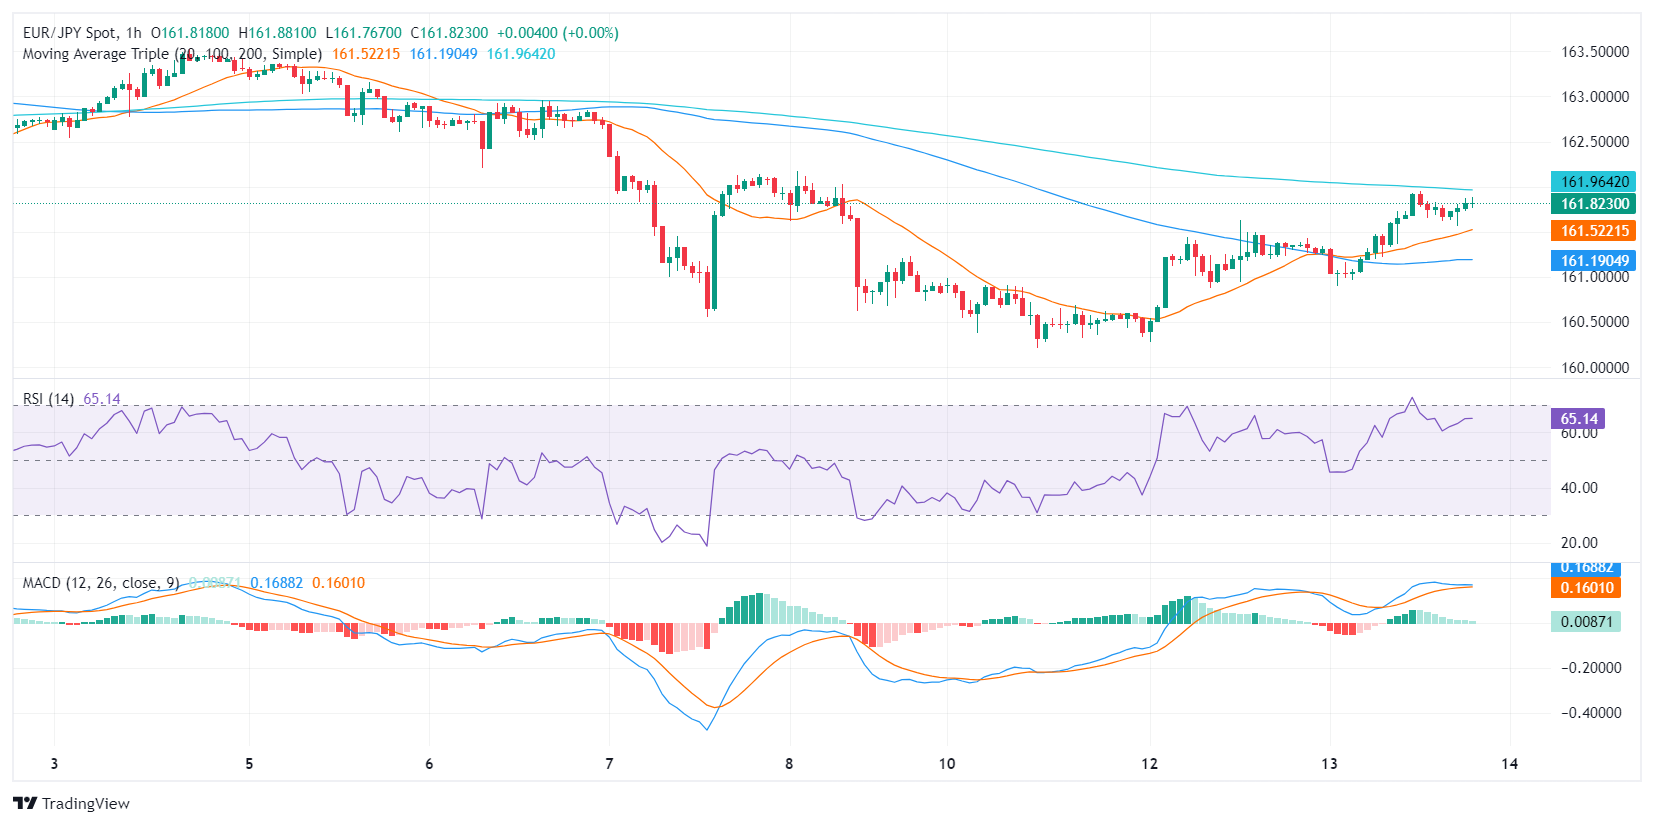
The EUR/JPY hourly chart shows that the RSI rose to around 60, matching the daily positive momentum. Nonetheless, despite the strong buying pressure, the MACD presents flat green bars, suggesting a stagnant bullish momentum. This reflects a potential consolidation phase for the remainder of the session.
EUR/JPY hourly chart'
In the broader scale technical outlook, despite the bears pulling the EUR/JPY pair below the 20-day Simple Moving Averages (SMA), it remains above both the 100 and 200-day SMAs. This indicates that the bulls continue to control the market on larger time frames. The buy signals indicated by the RSI on both the daily and hourly charts are slightly overshadowed by the stagnating MACD on the hourly chart as buyers might start to take profits in the coming hours.
Information on these pages contains forward-looking statements that involve risks and uncertainties. Markets and instruments profiled on this page are for informational purposes only and should not in any way come across as a recommendation to buy or sell in these assets. You should do your own thorough research before making any investment decisions. FXStreet does not in any way guarantee that this information is free from mistakes, errors, or material misstatements. It also does not guarantee that this information is of a timely nature. Investing in Open Markets involves a great deal of risk, including the loss of all or a portion of your investment, as well as emotional distress. All risks, losses and costs associated with investing, including total loss of principal, are your responsibility. The views and opinions expressed in this article are those of the authors and do not necessarily reflect the official policy or position of FXStreet nor its advertisers. The author will not be held responsible for information that is found at the end of links posted on this page.
If not otherwise explicitly mentioned in the body of the article, at the time of writing, the author has no position in any stock mentioned in this article and no business relationship with any company mentioned. The author has not received compensation for writing this article, other than from FXStreet.
FXStreet and the author do not provide personalized recommendations. The author makes no representations as to the accuracy, completeness, or suitability of this information. FXStreet and the author will not be liable for any errors, omissions or any losses, injuries or damages arising from this information and its display or use. Errors and omissions excepted.
The author and FXStreet are not registered investment advisors and nothing in this article is intended to be investment advice.
Recommended content
Editors’ Picks
AUD/USD retargets the 0.6600 barrier and above
AUD/USD extended its positive streak for the sixth session in a row at the beginning of the week, managing to retest the transitory 100-day SMA near 0.6580 on the back of the solid performance of the commodity complex.
EUR/USD keeps the bullish bias above 1.0700
EUR/USD rapidly set aside Friday’s decline and regained strong upside traction in response to the marked retracement in the Greenback following the still-unconfirmed FX intervention by the Japanese MoF.
Gold advances for a third consecutive day
Gold fluctuates in a relatively tight channel above $2,330 on Monday. The benchmark 10-year US Treasury bond yield corrects lower and helps XAU/USD limit its losses ahead of this week's key Fed policy meeting.
Bitcoin price dips to $62K range despite growing international BTC validation via spot ETFs
Bitcoin (BTC) price closed down for four weeks in a row, based on the weekly chart, and could be on track for another red candle this week. The last time it did this was in the middle of the bear market when it fell by 42% within a span of nine weeks.
Japan intervention: Will it work?
Dear Japan Intervenes in the Yen for the first time since November 2022 Will it work? Have we seen a top in USDJPY? Let's go through the charts.