|

EUR/GPB Price Analysis: Steady around 0.8340

  • The shared currency edges lower during the New York session by 0.14%.
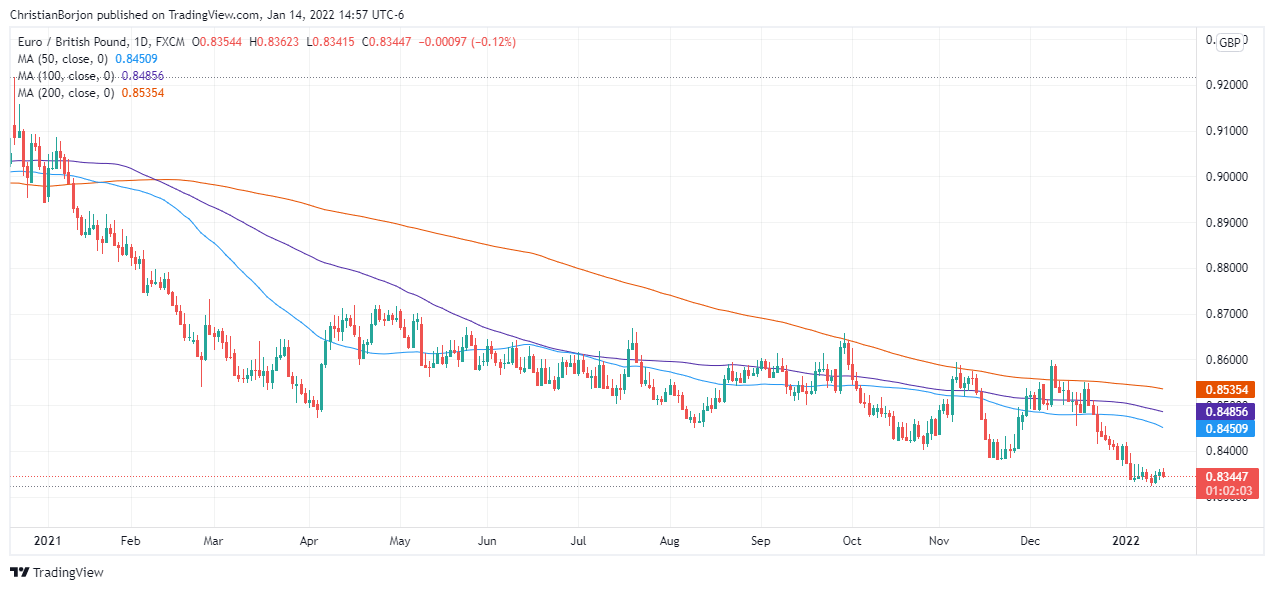
  • EUR/GBP Technical Outlook: Downward biased, but a break under the 0.8300 figure, would push the pair towards lower prices.

The EUR/GBP slide for the second time of the week, though, remains trapped in the 0.8320-65 range for the sixth consecutive day. The EUR/GBP is trading at 0.8347 as the New York session winds down. at the time of writing

The market mood is downbeat, as shown by global equity indices posting losses on Friday. In the US, except for the Nasdaq 100 gaining half percent, the rest print losses between 0.08% and 0.75%.

EUR/GBP Price Forecast: Technical outlook

The EUR/GBP daily chart shows the cross-currency is making a strong base in the 0.8320-65 area. From a technical perspective, the EUR/GBP is downward biased but, the 0.8300 barriers kept GBP bulls uncommitted of opening fresh bets vs. the euro.

On the downside, the EUR/GBP first support level would be the YTD low at 0.8324. A breach of the latter would expose the figure at 0.8300, followed by November 2019, with monthly lows around 0.8276.

Contrarily, to the upside, the first resistance would be 0.8372. A clear break of that level would expose January 3 daily high at 0.8419, which, once broken, might open the door for further gains for the shared currency. The next supply zone would be the 50-day moving average (DMA) at 0.8455, followed by the confluence of the 100-DMA and the psychological 0,8500 level.

EUR/GBP

Overview
Today last price0.8345
Today Daily Change-0.0012
Today Daily Change %-0.14
Today daily open0.8357
 
Trends
Daily SMA200.8406
Daily SMA500.8459
Daily SMA1000.8492
Daily SMA2000.8542
 
Levels
Previous Daily High0.836
Previous Daily Low0.8336
Previous Weekly High0.8419
Previous Weekly Low0.8335
Previous Monthly High0.86
Previous Monthly Low0.8368
Daily Fibonacci 38.2%0.8351
Daily Fibonacci 61.8%0.8346
Daily Pivot Point S10.8342
Daily Pivot Point S20.8328
Daily Pivot Point S30.8319
Daily Pivot Point R10.8366
Daily Pivot Point R20.8375
Daily Pivot Point R30.839

Author

Christian Borjon Valencia

Markets analyst, news editor, and trading instructor with over 14 years of experience across FX, commodities, US equity indices, and global macro markets.

More from Christian Borjon Valencia
Share:

Editor's Picks

AUD/USD falls to near 0.7100 after slipping below 50-day EMA

AUD/USD depreciates after registering minor gains in the previous day, trading around 0.7120 during the Asian hours. The technical analysis of the daily chart shows the pair consolidating sideways within a rectangle pattern, as neither bulls nor bears gain control. The AUD/USD pair is holding a slight bearish tone however as it sits beneath both the nine-day and 50-day EMAs.

160.00: USD/JPY back near intervention territory after upbeat US jobs report

US Nonfarm Payrolls beat expectations by a wide margin in May, with 172K jobs added. The US Dollar rebounds after the release, helping USD/JPY recover from its intraday lows. Warnings from Japanese authorities continue to limit upside potential near the 160.00 threshold.

Gold targets $4,300 amid stronger Dollar

Gold faces increasing selling interest and navigates the area of three-month lows near the $4,300 mark per troy ounce on Friday. The precious metal’s decline comes as traders assess the stronger-than-expected NFP, while the bid bias in the Greenback and higher US Treasury yields also collaborate with the retracement.

Cardano hits five-year low even as Hoskinson clarifies "break" isn't an exit

Cardano (ADA) price is down 10% at press time on Friday, extending losses over 30% so far this week amid Charles Hoskinson's clarification that "break" isn't an exit.

Week ahead – Fed countdown begins amid US inflation data and geopolitical risks

Fed Chair Warsh’s first meeting approaches as key US inflation data could reshape expectations. Oil prices remain elevated as US-Iran talks continue; tariffs also return to the spotlight. ECB is expected to hike; will it be a one-off move or is July live?

The US economy defies the rules: 100 days into the Oil shock and the recession signal is still missing

More than three months after the start of the Iran war and the resulting disruption to global energy markets, the US economy continues to display remarkable resilience. The conflict has triggered a sharp rise in Oil prices, reignited inflationary pressures and fueled widespread concerns about a potential economic slowdown.