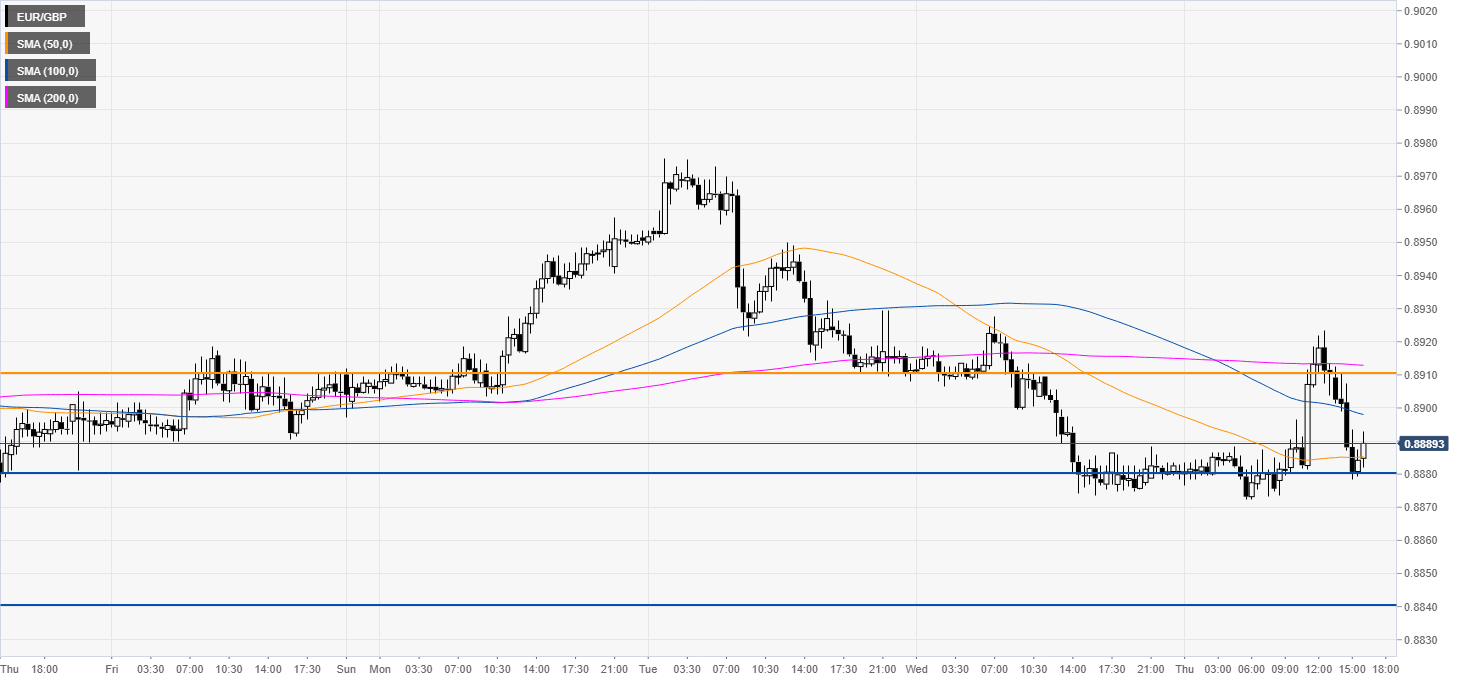
- EUR/GBP dropped to daily lows near 0.8880 support.
- Can the bulls lift the market to 0.8910 resistance?
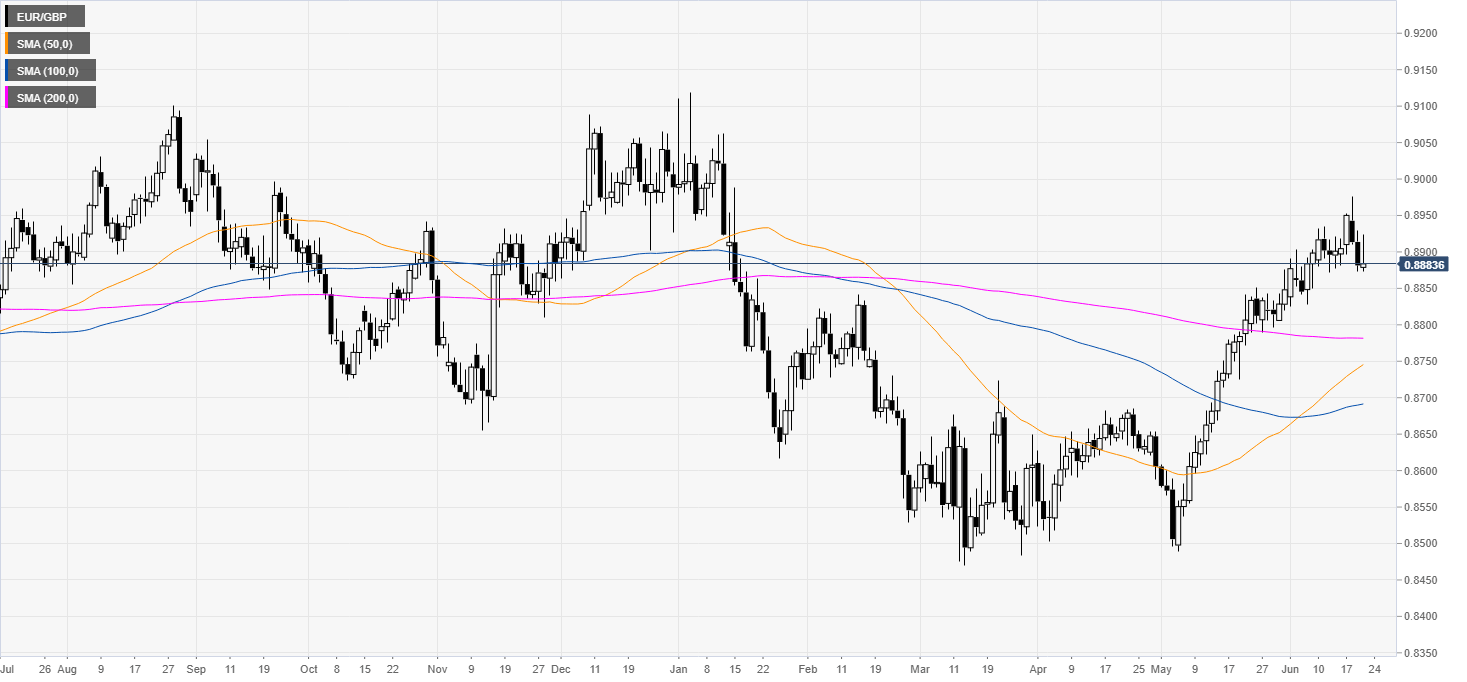
EUR/GBP daily chart
EUR/GBP is in a bull leg above its main simple moving averages (SMAs). The market attempted to break above Wednesday high but is currently under pressure below 0.8900 figure.
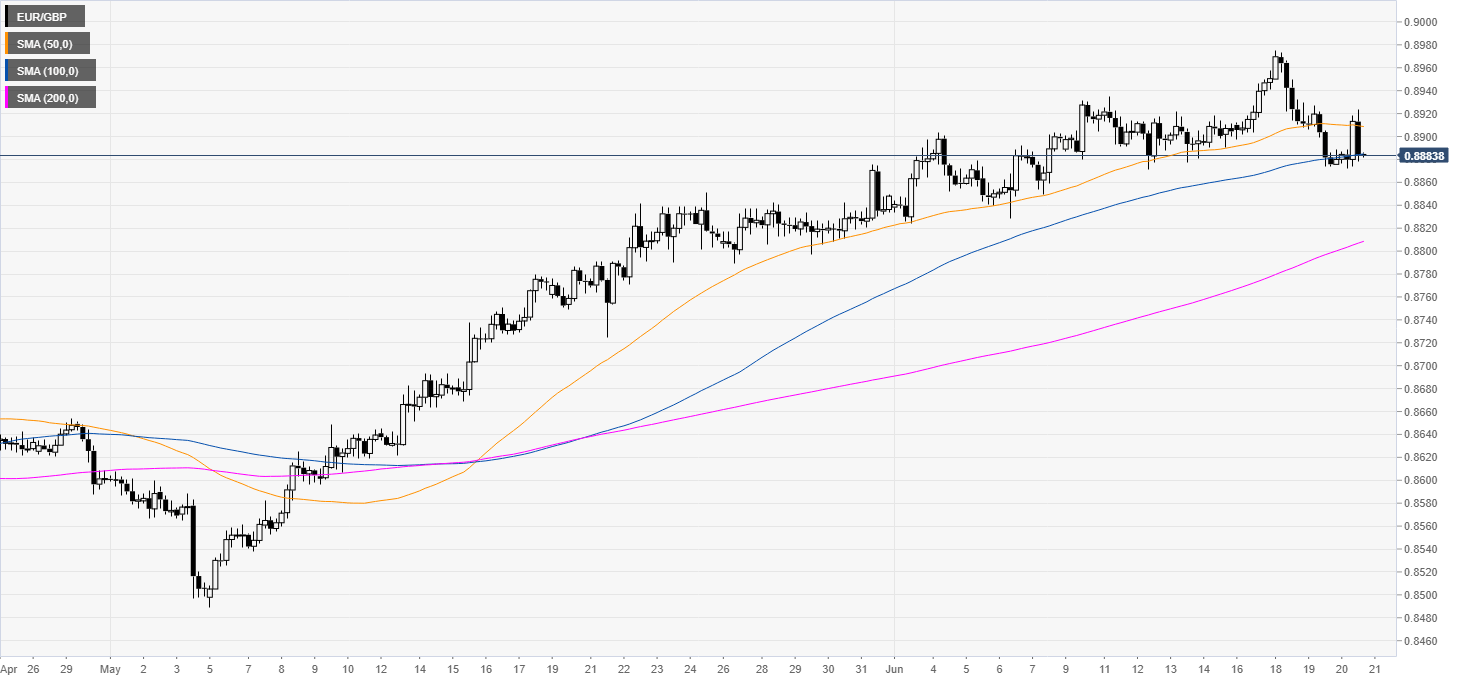
EUR/GBP 4-hour chart
The trend is slowing down as the market is trading below the 50 SMA and is challenging the 100 SMA.
EUR/GBP 30-minute chart
EUR/GBP is trading below its 100 and 200 SMAs suggesting potential bearish momentum. EUR/GBP found strong support near 0.8870/80 which is a cluster of technical levels according to the Technical Confluences Indicator. If the bears break this support the next level in line is seen at 0.8843 ( daily an weekly pivot point cluster). On the flip side, if the market finds some footing above 0.8880 EUR/GBP could rebound to 0.8910 resistance (technical levels cluster). Further up, lies 0.8935 resistance (previous week high and Wednesday high).
Additional key levels
Note: All information on this page is subject to change. The use of this website constitutes acceptance of our user agreement. Please read our privacy policy and legal disclaimer. Opinions expressed at FXstreet.com are those of the individual authors and do not necessarily represent the opinion of FXstreet.com or its management. Risk Disclosure: Trading foreign exchange on margin carries a high level of risk, and may not be suitable for all investors. The high degree of leverage can work against you as well as for you. Before deciding to invest in foreign exchange you should carefully consider your investment objectives, level of experience, and risk appetite. The possibility exists that you could sustain a loss of some or all of your initial investment and therefore you should not invest money that you cannot afford to lose. You should be aware of all the risks associated with foreign exchange trading, and seek advice from an independent financial advisor if you have any doubts.
Recommended content
Editors’ Picks
EUR/USD trades weak below 1.0800 amid Good Friday lull, ahead of US PCE
EUR/USD remains depressed below 1.0800 after soft French inflation data, amid minimal volatility and thin liquidity on Good Friday. The pair keenly awaits the US PCE inflation data and Fed Chair Powell's speech for fresh hints on next week's price action.
GBP/USD holds steady above 1.2600 as markets stay calm on Good Friday
GBP/USD trades sideways above 1.2600 amid a typical Good Friday trading lull. A broadly firmer US Dollar could keep any upside attempts limited in the pair ahead of the US PCE inflation data and Fed Chair Powell's appearance.
Gold price sits at all-time highs above $2,230, US PCE eyed
Gold price hit all-time highs at $2,236 on Thursday to finish Q1 2024 with a bang. Most major world markets, including the US are closed due to Holy Friday, leaving volatility around Gold price highly subdued. US PCE inflation and Powell are awaited.
Jito price could hit $6 as JTO coils up inside this bullish pattern
Jito (JTO) price has been on an uptrend since forming a local bottom in early January. Since then, JTO has revisited the key swing point formed in early December, suggesting the bulls’ intention to move higher.
Key events in developed markets next week
Next week, the main focus will be inflation and the labour market in the Eurozone. We expect services inflation to be impacted by the easter effect, while the unemployment rate to be unchanged.