|

EUR/GBP technical analysis: 0.8842 is the key resistance to break for a continuation up

  • EUR/GBP has seen a very strong recovery in the month of May can the bulls sustain the trend? 
  • The 0.8842 resistance is for now a tough nut to crack. 
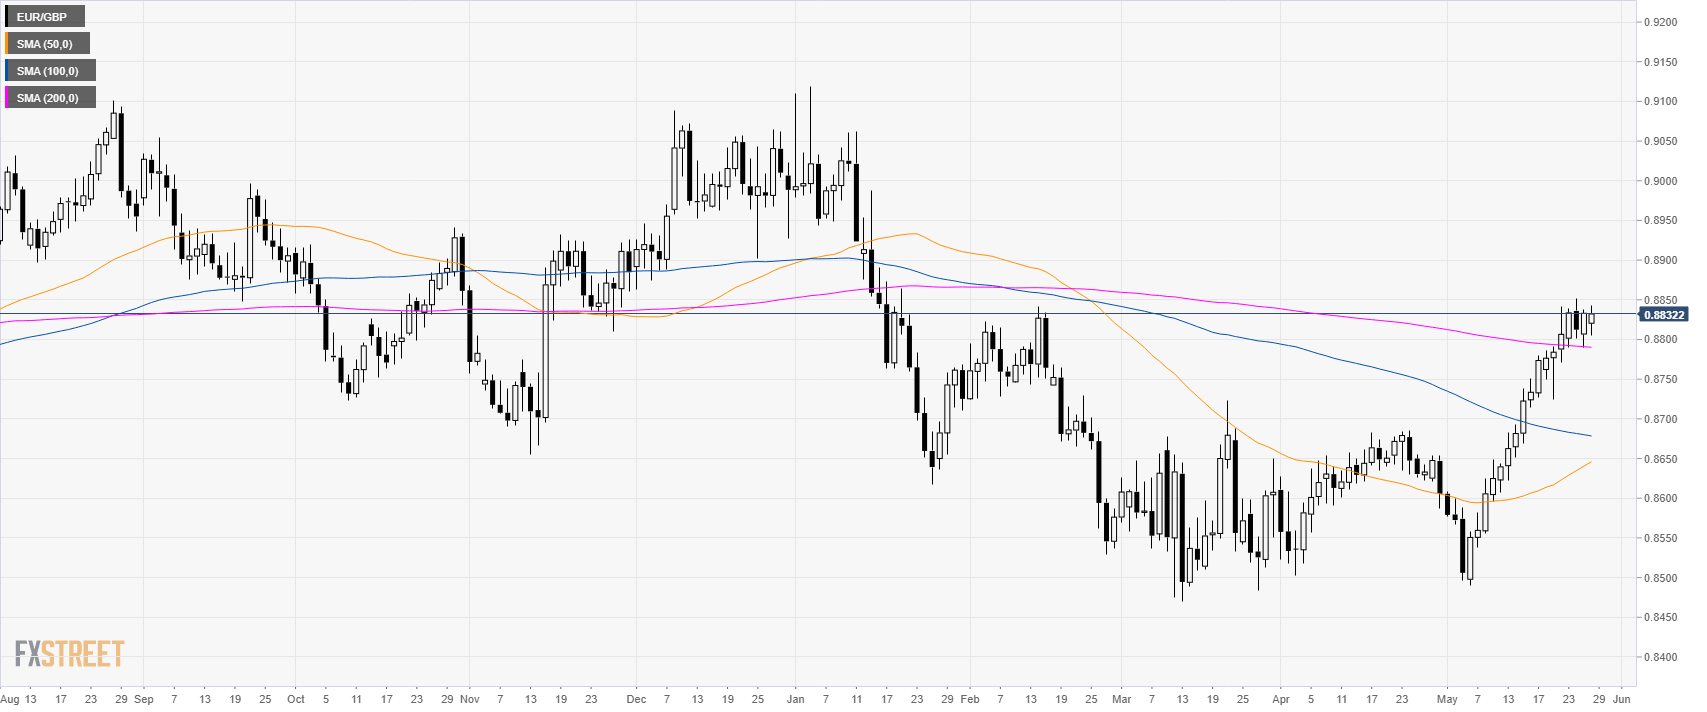
EUR/GBP daily

EUR/GBP enjoyed a rather bullish month in May as the market broke to 3-month high and above the 200 simple moving average (SMA).


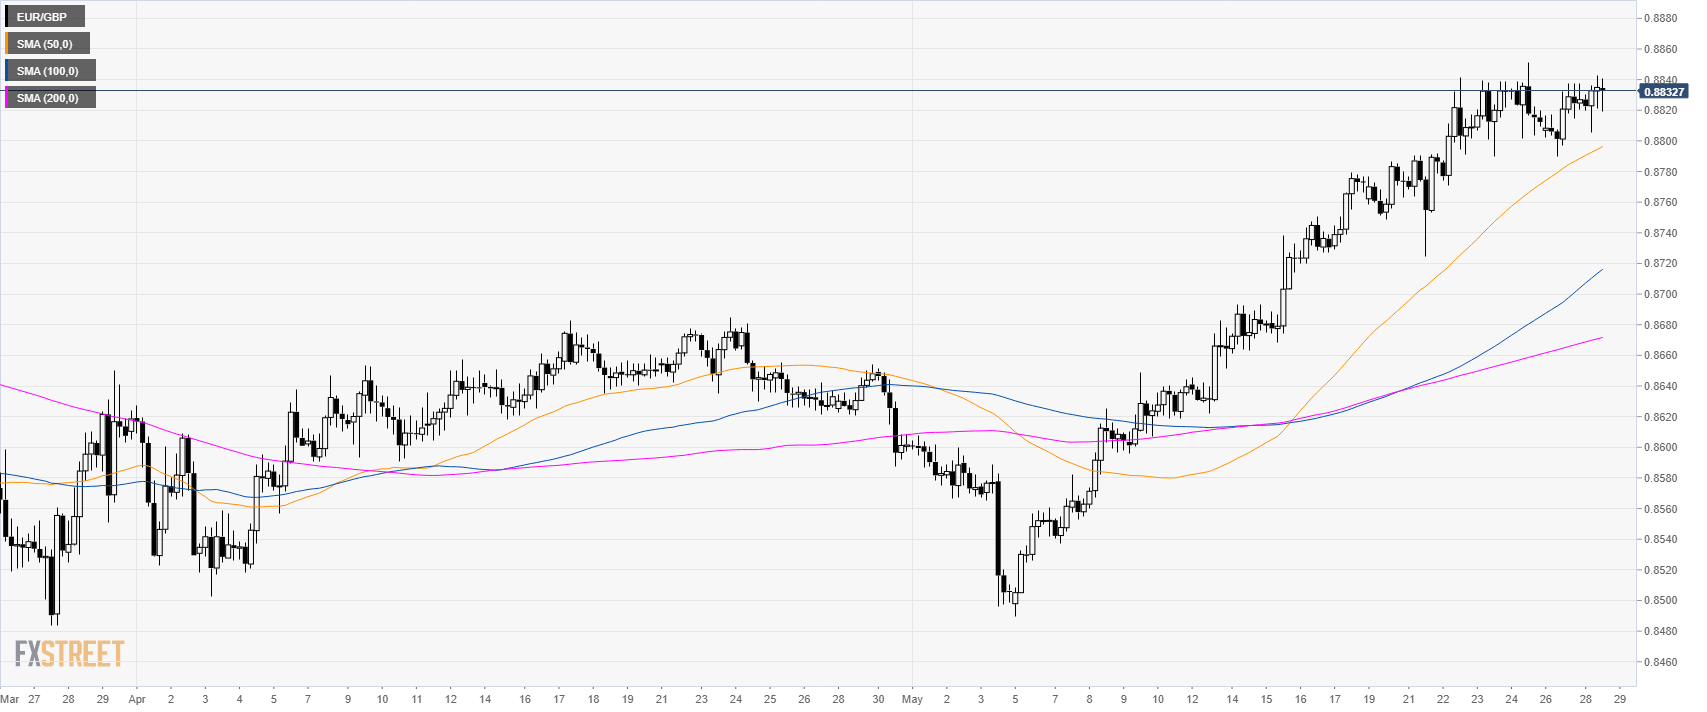
EUR/GBP 4-hour chart


EUR/GBP is trading in a bullish channel above its main SMAs suggesting a bullish bias in the medium term.

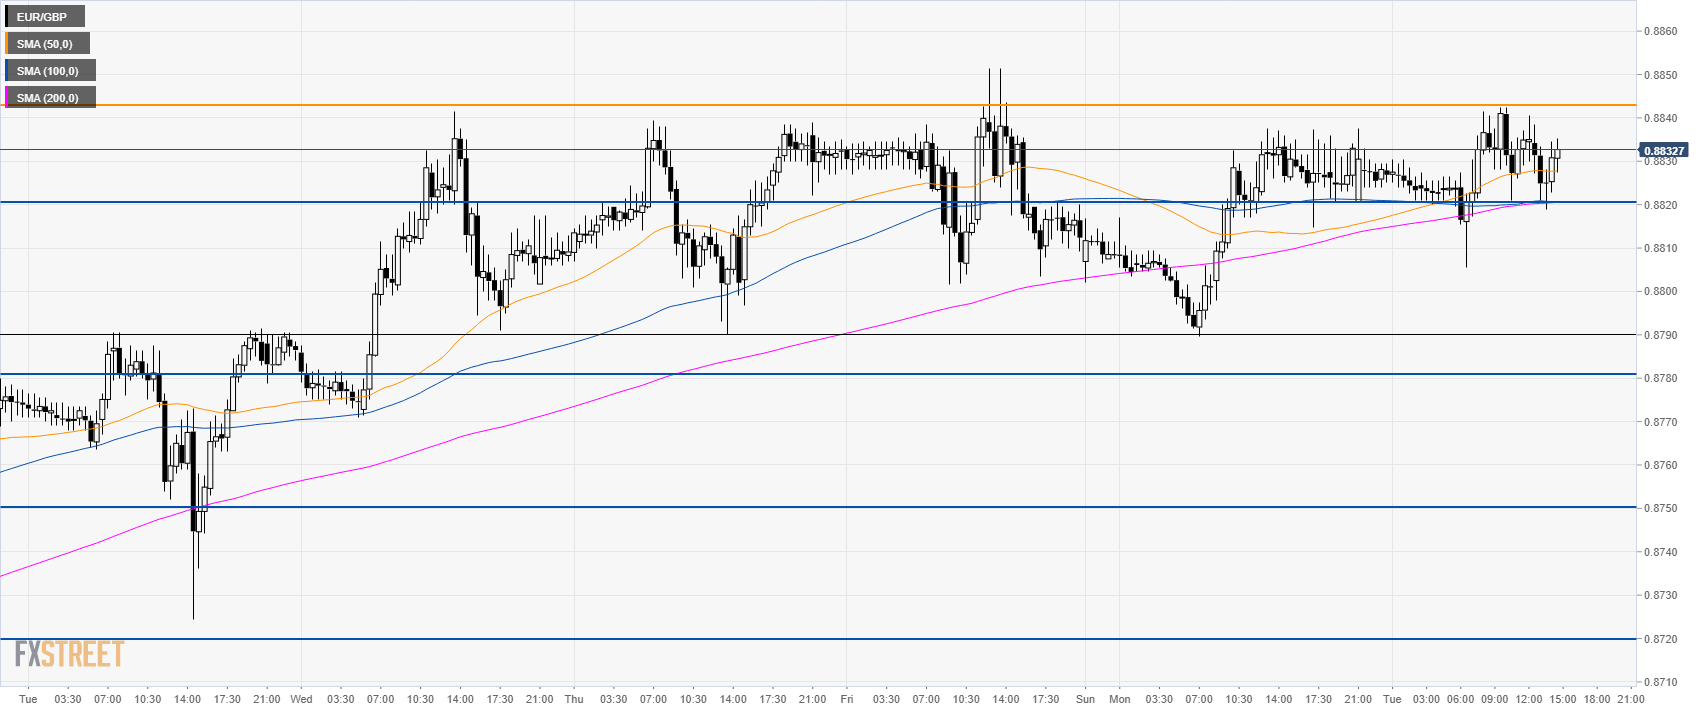
EUR/GBP 30-minute chart

EUR/GBP has been consolidating below 0.8842 resistance in the last four days. In the absence of a sustained break above 0.8842 the market drift lower towards 0.8780, 0.8750 and potentially 0.8720 level. However, if the market break beyond 0.8842 then a move up to 0.8900 figure can be on the cards for bulls.


Additional key levels

EUR/GBP

Overview
Today last price0.883
Today Daily Change-0.0003
Today Daily Change %-0.03
Today daily open0.8833
 
Trends
Daily SMA200.8683
Daily SMA500.864
Daily SMA1000.868
Daily SMA2000.8791
Levels
Previous Daily High0.8838
Previous Daily Low0.879
Previous Weekly High0.8852
Previous Weekly Low0.8724
Previous Monthly High0.8685
Previous Monthly Low0.8502
Daily Fibonacci 38.2%0.8819
Daily Fibonacci 61.8%0.8808
Daily Pivot Point S10.8802
Daily Pivot Point S20.8772
Daily Pivot Point S30.8754
Daily Pivot Point R10.885
Daily Pivot Point R20.8868
Daily Pivot Point R30.8898

Author

Flavio Tosti

Flavio Tosti

Independent Analyst


More from Flavio Tosti
Share:

Editor's Picks

EUR/USD flirts with weekly lows near 1.1770

EUR/USD now comes under further selling pressure, breaking below the 1.1800 support to challenge the area of weekly throughs near 1.1770 on Thursday. The pair’s decline comes in response to marked gains in the US Dollar amid steady geopolitical tensions. Ealier in the day, the ECB’s Lagarde delivered cautious remarks, although the currency remained apathetic.

GBP/USD threatens the 200-day SMA near 1.3440

GBP/USD rapidly leaves behind Wednesday’s strong advance, coming under heavy pressure and retesting the 1.3440 zone, where the critical 200-day SMA is located. Cable’s deep pullback follows the strong gains in the Greenback, while investors continue to pencil in a potential BoE rate cut in March.

Gold trims gains, slips back to around $5,170

Gold is now facing some downside pressure, hovering around the $5,170 region on Thursday. The yellow metal surrenders part of its earlier gains on the back of the resurgence of the buying interest in the Greenback. In the meantime, geopolitical tensions in the Middle East continue to limit the downside potential for now.

Stellar: Relief bounce fades as bearish undertone persists

Stellar is trading around $0.16 at the time of writing on Thursday after rebounding more than 8% in the previous day. Derivatives data paints a negative picture as XLM’s short bets hit a monthly high while Open Interest continues to decline.

Changing the game: International implications of recent tariff developments

The Supreme Court ruling on International Emergency Economic Powers Act (IEEPA) tariffs provides limited relief for the rest of the world, with weighted average tariff rates modestly lower.

Bitcoin steadies as traders eye US–Iran talks

Bitcoin (BTC) price is stabilizing around $68,000 at the time of writing on Thursday after a 6.2% relief rally the previous day amid a broader downward trend.