EUR/GBP stands flat after European inflation figures from February
- The EUR/GBP is currently trading at 0.8560, revealing a mild daily gain in Friday's session.
- The HICP from the EU grew at a higher pace than expected in February,
- Focus now turns to the ECB decision next week, with a hold already priced in.

The EUR/GBP currency pair is currently trading at around 0.8560, registering slight gains after the report of the Harmonized Index of Consumer Prices (HICP) from the Eurozone from February which came in higher than expected. Focus now shifts to next week's European Central Bank (ECB).
Inflation data for the Eurozone in February was slightly above expectations, with the headline rate rising 2.6% year-over-year, compared to the anticipated 2.5%, and down from 2.8% in January. The core inflation rate also exceeded forecasts, coming in at 3.1% year-over-year versus the expected 2.9%, down from January's 3.3%. These figures indicate that while inflation is gradually decreasing, the decrease is not occurring linearly.
Regarding expectations on the next ECB meetings, markets seem to be eying June for the beginning of the easing cycle. For next week, a hold is being priced in while the odds of a cut in April remain low, near 25%. On the Bank of England’s hand, markets are delaying the first cut to August, which seems to give the Pound a slight advantage.
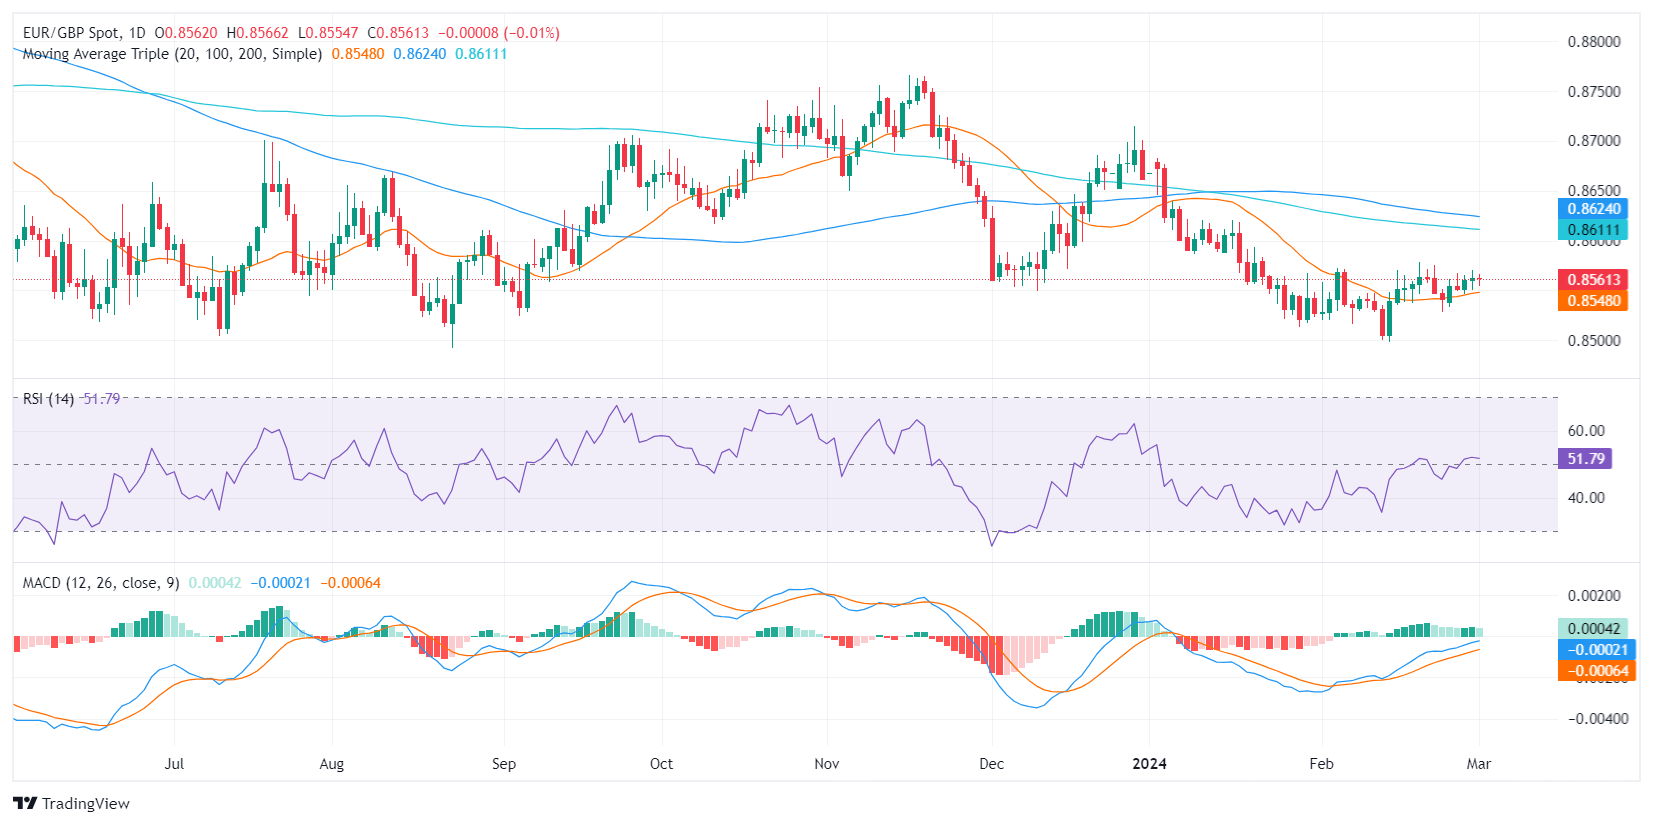
EUR/GBP technical analysis
In recent sessions, the Relative Strength Index (RSI) has fluttered around the neutral area, suggesting a balance between buyers and sellers. The slight increase over the several previous days signals a nascent positive momentum for EUR/GBP, nonetheless, the market is yet to choose a definite direction.
The Moving Average Convergence Divergence (MACD) histogram's flat green bars display a pause in the pair's bullish momentum, implying indecision in the market. Low volatility and the market’s hesitation to choose a direction validate this outlook.
However, the pair remaining above the 20-day Simple Moving Averages (SMAs), while being below the 100 and 200-day SMA, asserts that bears have a grip on the larger timeframe but the bulls are in front for the shorter timeframe.
Author

Patricio Martín
FXStreet
Patricio is an economist from Argentina passionate about global finance and understanding the daily movements of the markets.


