|

EUR/GBP records modest gains amidst low liquidity conditions on Good Friday

  • EUR/GBP barely moved the needle amidst thin liquidity conditions on a worldwide holiday.
  • A solid US jobs report pushed recession fears away, as US equity futures showed.

The EUR/GBP advances for two straight days and hits a four-day high of around 0.8790 on a subdued trading session in observance of the Good Friday holiday. The EUR/GBP is trading at 0.8782, registering minuscule gains of 0.04%.

The cash market is closed due to a holiday. However, the US futures market is open, and equities have responded optimistically to the latest round of US economic data and edged higher. The US Nonfarm Payrolls March report was solid, though a whisker below estimates of 240K, at 236K. Some of the highlights of the report came above estimates. The Participation Rate climbed to 62.6%, above forecasts of 62.4%, while the Unemployment Rate remained unchanged at 3.6% YoY. Average Hourly Earnings dipped to 4.2% YoY, below the 4.3% foresaw.

Aside from this, a light Eurozone (EU) and United Kingdom (UK) economic dockets left traders adrift to data from the United States (US).

On Thursday, the European Central Bank (ECB) economist Philip Lange flagged the risk of further rate hikes. He said, “If the baseline we developed before the banking stress holds up, it will be appropriate to have a further increase in May.” Lane added that they would be data-dependant “about assessing whether that baseline still holds true at the time of our May meeting.”

Meanwhile, Worldwide Interest Rate Probabilities (WIRP) show odds for a 25 bps rate hike by the European Central Bank at 90%. Following that, another 25 bps rate increase is expected, and no movement for Q4.

EUR/GBP Technical Analysis

EUR/GBP Daily Chart

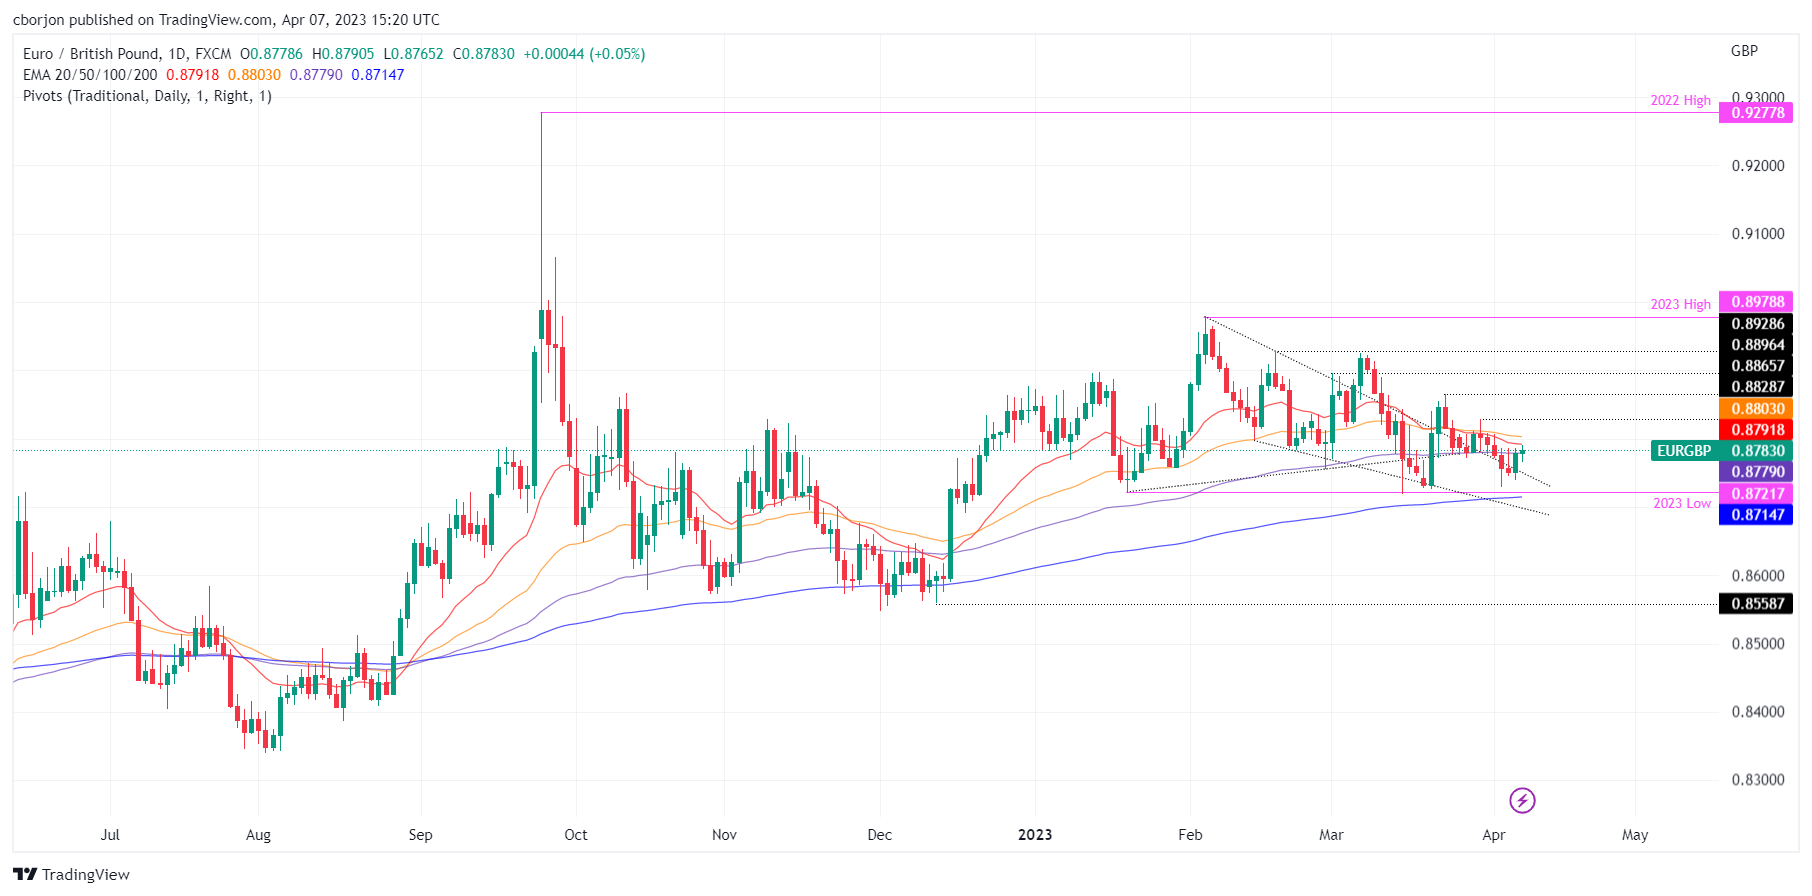
The EUR/GBP daily chart suggests the pair would end the week trading sideways, capped to the upside, by the confluence of the 20 and 50-day Exponential Moving Averages (EMAs) at 0.8791 and 0.8803, respectively. For a bullish resumption, the EUR/GBP must reclaim 0.8805, so the pair could test the March 30 high at 0.8828, followed by March 23 cycle high at 0.8865.

On the downside, the EUR/GBP price action is capped by the 100-day EMA at 0.8779. Once broken, the EUR/GBP could dip towards April 6 low at 0.8739, followed by the 200-day EMA at 0.8714, before dropping to 0.8700.

EUR/GBP Technical Levels

EUR/GBP

Overview
Today last price0.8784
Today Daily Change0.0005
Today Daily Change %0.06
Today daily open0.8779
 
Trends
Daily SMA200.8792
Daily SMA500.8832
Daily SMA1000.8782
Daily SMA2000.8697
 
Levels
Previous Daily High0.8786
Previous Daily Low0.8739
Previous Weekly High0.8828
Previous Weekly Low0.8771
Previous Monthly High0.8925
Previous Monthly Low0.8718
Daily Fibonacci 38.2%0.8768
Daily Fibonacci 61.8%0.8757
Daily Pivot Point S10.875
Daily Pivot Point S20.8721
Daily Pivot Point S30.8704
Daily Pivot Point R10.8796
Daily Pivot Point R20.8814
Daily Pivot Point R30.8843

Author

Christian Borjon Valencia

Markets analyst, news editor, and trading instructor with over 14 years of experience across FX, commodities, US equity indices, and global macro markets.

More from Christian Borjon Valencia
Share:

Editor's Picks

EUR/USD extends losses toward 1.1600 ahead of EU inflation data

EUR/USD extends the decline toward 1.1600 in the European session on Tuesday. The pair remains under pressure as surging energy prices amid the US-Iran war have increased the risks of higher inflation for the Old Continent. The focus is now on the Eurozone preliminary inflation reading for February. 

GBP/USD attacks 1.3300, refreshing three-month lows

GBP/USD is deep in the red near 1.3300, accelerating its downside to renew three-month lows in European trading on Tuesday. The ongoing escalation in the Iran war, combined with rising Oil prices, weighs negatively on the higher-yielding Pound Sterling as the US Dollar capitalizes on increased haven demand.

Gold falls below $5,300 as stronger USD counter Middle East woes

Gold attracts some intraday selling and falls below $5,300 on Tuesday. The US Dollar climbs to a fresh high since January 20 and turns out to be a key factor exerting downward pressure on the commodity. However, concerns about a broader regional conflict in the Middle East continue to weigh on investors' sentiment and underpin demand for the traditional safe-haven bullion.

Stellar risks deeper losses as derivatives metrics turn negative

Stellar is trading red below $0.16 at the time of writing on Tuesday, after a slight recovery the previous day. Weakening derivatives data caps the recovery, while an unfavorable technical outlook projects a deeper correction for the XLM token in the upcoming days.

The market is not panicking it is repricing the probability distribution of Oil and time

At the end of the day, markets do not trade morality or geopolitics. They trade transmission channels. And the only channel that truly matters in this maelstrom runs through the price of energy and the time value of money.

Hyperliquid Price Forecast: HYPE rises on commodities demand amid US-Iran war

Hyperliquid (HYPE) steadies above $33 at press time on Tuesday, marking its fourth consecutive day of recovery in a broadly volatile market due to the ongoing US-Israel strikes on Iran.