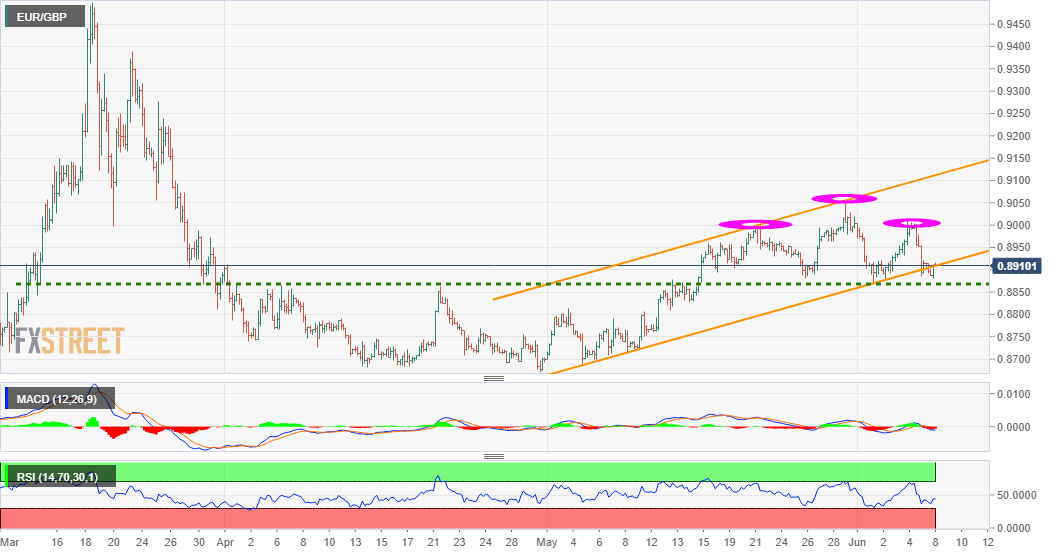
- EUR/GBP stages a modest bounce on Monday to test an ascending channel support breakpoint.
- The formation of a bearish head and shoulders seems to have shifted the bias in favour of bears.
- A convincing breakthrough the 0.8865 horizontal support zone will reinforce the bearish set-up.
- Only a sustained move back above the 0.9900 round-figure mark will negate the negative bias.
The EUR/GBP cross reversed an early dip to the 0.8880 region and jumped to fresh daily tops during the early European session. The cross was last seen trading near a short-term ascending trend-channel support breakpoint, now turned resistance around the 0.8910 region.
Meanwhile, Friday's break below the mentioned channel comes on the back of a bearish head and shoulders pattern formation on the 4-hourly chart. The bearish set-up is reinforced by the fact that technical indicators on hourly charts are holding in the negative territory.
However, oscillators on the daily chart are yet to confirm the bearish bias and warrant some caution. This makes it prudent to wait for a sustained break below a previous strong horizontal resistance breakpoint, now turned support near the 0.8865 region before placing fresh bearish bets.
Below the mentioned support the cross is likely to accelerate the fall towards the 0.8815-10 area with some intermediate support near the 0.8835 level. The downward trajectory could further get extended below the 0.8800 mark, towards the next major support near the 0.8760 region.
On the flip side, any subsequent move up is likely to confront a stiff resistance near the 0.8835-40 region, above which the cross might aim to reclaim the key 0.9000 psychological mark. A sustained strength beyond the mentioned level is needed to negate any near-term bearish bias.
EUR/GBP 4-hourly chart
Technical levels to watch
Information on these pages contains forward-looking statements that involve risks and uncertainties. Markets and instruments profiled on this page are for informational purposes only and should not in any way come across as a recommendation to buy or sell in these assets. You should do your own thorough research before making any investment decisions. FXStreet does not in any way guarantee that this information is free from mistakes, errors, or material misstatements. It also does not guarantee that this information is of a timely nature. Investing in Open Markets involves a great deal of risk, including the loss of all or a portion of your investment, as well as emotional distress. All risks, losses and costs associated with investing, including total loss of principal, are your responsibility. The views and opinions expressed in this article are those of the authors and do not necessarily reflect the official policy or position of FXStreet nor its advertisers. The author will not be held responsible for information that is found at the end of links posted on this page.
If not otherwise explicitly mentioned in the body of the article, at the time of writing, the author has no position in any stock mentioned in this article and no business relationship with any company mentioned. The author has not received compensation for writing this article, other than from FXStreet.
FXStreet and the author do not provide personalized recommendations. The author makes no representations as to the accuracy, completeness, or suitability of this information. FXStreet and the author will not be liable for any errors, omissions or any losses, injuries or damages arising from this information and its display or use. Errors and omissions excepted.
The author and FXStreet are not registered investment advisors and nothing in this article is intended to be investment advice.
Recommended content
Editors’ Picks
EUR/USD trades with negative bias, holds above 1.0700 as traders await US PCE Price Index

EUR/USD edges lower during the Asian session on Friday and moves away from a two-week high, around the 1.0740 area touched the previous day. Spot prices trade around the 1.0725-1.0720 region and remain at the mercy of the US Dollar price dynamics ahead of the crucial US data.
USD/JPY jumps above 156.00 on BoJ's steady policy

USD/JPY has come under intense buying pressure, surging past 156.00 after the Bank of Japan kept the key rate unchanged but tweaked its policy statement. The BoJ maintained its fiscal year 2024 and 2025 core inflation forecasts, disappointing the Japanese Yen buyers.
Gold price flatlines as traders look to US PCE Price Index for some meaningful impetus

Gold price lacks any firm intraday direction and is influenced by a combination of diverging forces. The weaker US GDP print and a rise in US inflation benefit the metal amid subdued USD demand. Hawkish Fed expectations cap the upside as traders await the release of the US PCE Price Index.
Sei Price Prediction: SEI is in the zone of interest after a 10% leap

Sei price has been in recovery mode for almost ten days now, following a fall of almost 65% beginning in mid-March. While the SEI bulls continue to show strength, the uptrend could prove premature as massive bearish sentiment hovers above the altcoin’s price.
US economy: Slower growth with stronger inflation

The US Dollar strengthened, and stocks fell after statistical data from the US. The focus was on the preliminary estimate of GDP for the first quarter. Annualised quarterly growth came in at just 1.6%, down from the 2.5% and 3.4% previously forecast.