|

EUR/GBP Price Analysis: Bulls jump around 0.8550 and lift the pair to fresh 2-week highs above 0.8600

  • The EUR/GBP seesawed in a volatile 100-pip trading session on Friday.
  • Weak data from the UK and the EU left traders undecided on which direction to take.
  • The EUR/GBP daily chart depicts the pair as upward biased, but the 4-hour illustrates the cross might correct towards 0.8550 before resuming the uptrend.

The EUR/GBP advances during the day, though retraced from near two-week highs around 0.8678 on Friday, amidst an upbeat market mood that triggered support for risk-sensitive currencies in the FX space, the British pound one of them. At 0.8621, the EUR/GBP is trading in the green by just 0.19%.

A volatile session characterized EUR/GBP Friday’s price action. Weaker than expected, UK’s factory data lifted the cross-currency. Nevertheless, it began to pare its losses of late after hot Eurozone inflation, alongside languish factory output, was reported, painting a gloomy scenario for the EU.
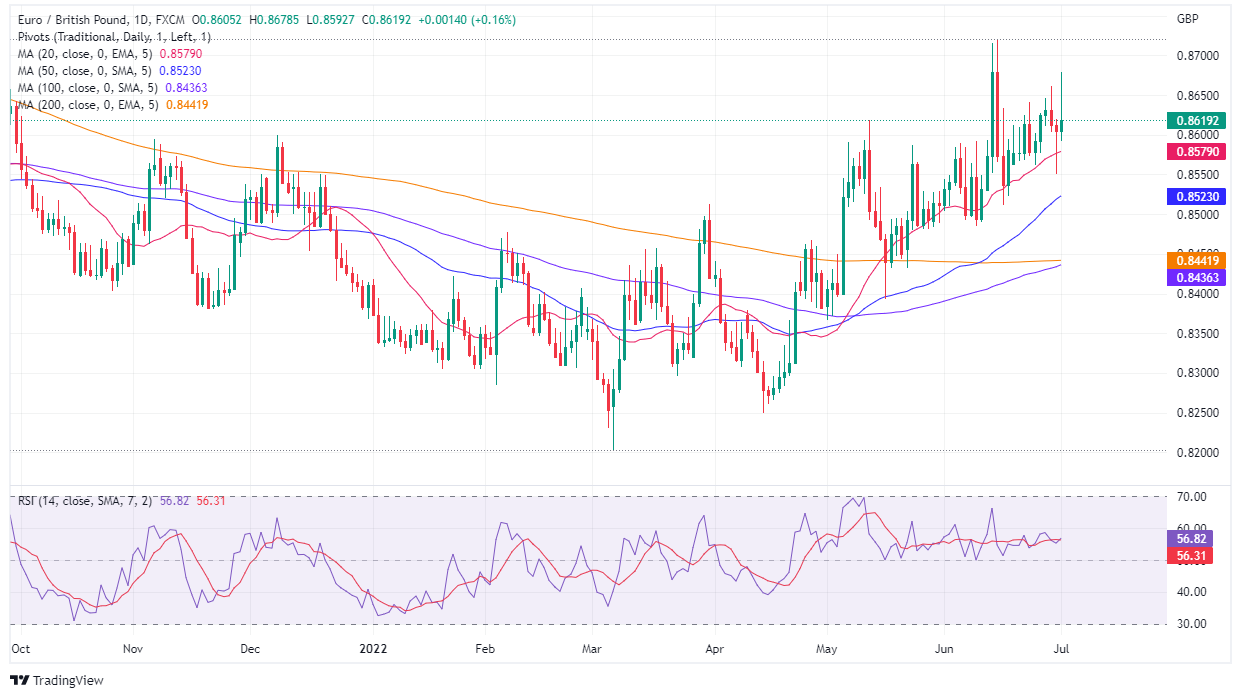
EUR/GBP Daily chart

The EUR/GBP daily chart depicts the pair as neutral-upward biased. Traders should note how the Relative Strength Index (RSI) stayed steady between 50 and 70 since May, while the EUR/GBP rallied from 0.8250 to the YTD high above 0.8700. Therefore, the EUR/GBP might extend its rally in the near term and even challenge the YTD high above 0.8700, but a break above 0.8678 is needed. On the other hand, if EUR/GBP sellers plunge prices below 0.8550, that could pave the way to the 200-day EMA at 0.8442.

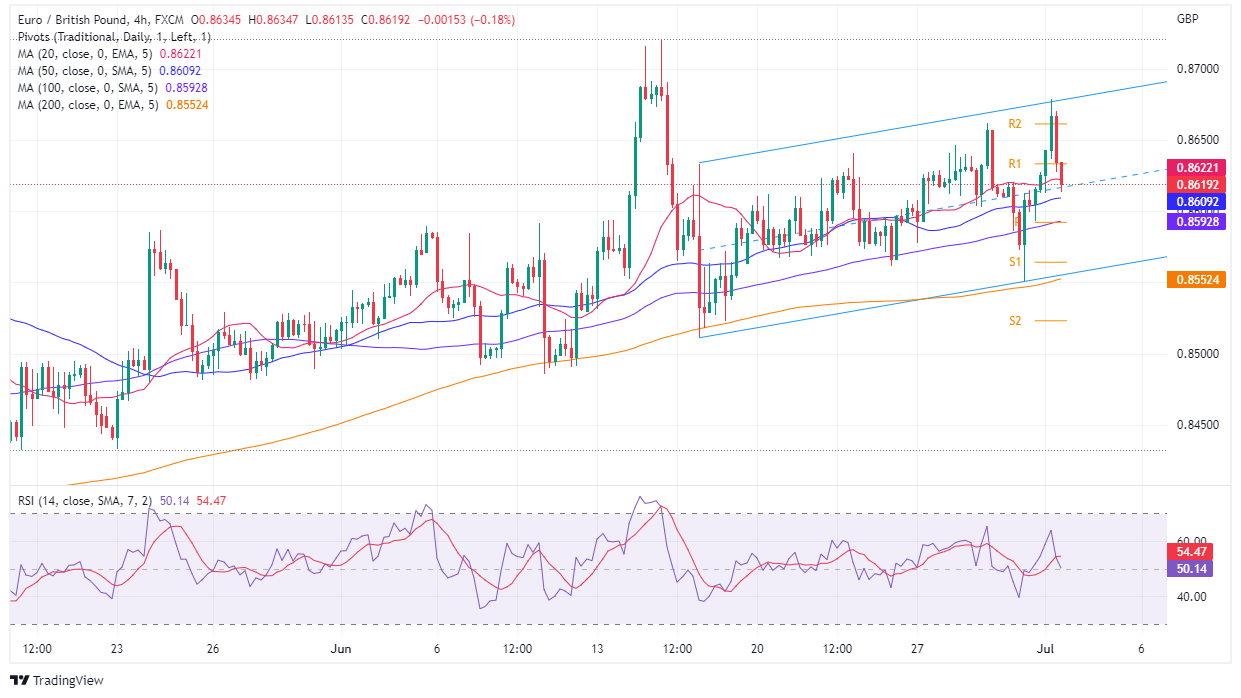
EUR/GBP 4-Hour chart

In the near term, the EUR/GBP 4-hour chart depicts the pair trading inside an ascending channel that has kept the cross-currency pair trading within a 100-pip range. On Friday, the cross reached the top of the range and reversed, piercing the R2 and R1 daily pivots, each at 0.8662 and 0.8633, before settling around the 20-EMA at 0.8622. Also, the Relative Strength Index (RSI) at 50.72 accelerates its fall towards the mid-line, and a cross below would pave the way for further downside in the EUR/GBP pair.

Therefore, the EUR/GBP’s first support would be the 50-EMA at 0.8609. Break below would expose the 100-EMA at 0.8592, followed by the June 30 swing low at 0.8551.

EUR/GBP Key Technical Levels


Overview
Today last price0.8619
Today Daily Change0.0010
Today Daily Change %0.12
Today daily open0.861
 
Trends
Daily SMA200.8581
Daily SMA500.8524
Daily SMA1000.8438
Daily SMA2000.8446
 
Levels
Previous Daily High0.862
Previous Daily Low0.8551
Previous Weekly High0.8641
Previous Weekly Low0.8562
Previous Monthly High0.8721
Previous Monthly Low0.8486
Daily Fibonacci 38.2%0.8577
Daily Fibonacci 61.8%0.8594
Daily Pivot Point S10.8568
Daily Pivot Point S20.8525
Daily Pivot Point S30.8499
Daily Pivot Point R10.8637
Daily Pivot Point R20.8663
Daily Pivot Point R30.8706

Author

Christian Borjon Valencia

Christian Borjon began his career as a retail trader in 2010, mainly focused on technical analysis and strategies around it. He started as a swing trader, as he used to work in another industry unrelated to the financial markets.

More from Christian Borjon Valencia
Share:

Markets move fast. We move first.

Orange Juice Newsletter brings you expert driven insights - not headlines. Every day on your inbox.

By subscribing you agree to our Terms and conditions.

Editor's Picks

EUR/USD off three-month highs, holds near 1.1800 on softer US Dollar

EUR/USD consolidates gains below 1.1800 in the European trading hours on Wednesday. A broadly subdued US Dollar continues to underpin the pair amid quiet markets and thin liquidity conditions on Christmas Eve. 

GBP/USD keeps range around 1.3500 amid quiet markets

GBP/USD keeps its range trade intact at around 1.3500 in the European session on Wednesday. The Pound Sterling holds the upper hand over the US Dollar amid pre-Christmas light trading as traders turn to sidelines heading into the holiday season. 

Gold retreats from record highs amid profit-taking on Christmas Eve

Gold retreats following the move higher to the $4,525 area, or a fresh all-time peak, though the downside remains limited amid a bullish fundamental backdrop. The US Dollar selling bias remains unabated on the back of dovish Fed expectations, which continues to act as a tailwind for the bullion amid persistent geopolitical risks.

Shiba Inu's bears tighten grip, aiming for yearly lows

Shiba Inu price remains under pressure, trading below $0.000070 on Wednesday as bearish momentum continues to dominate the broader crypto market. On-chain and derivatives data further support the bearish sentiment, while technical analysis suggests a deeper correction targeting the yearly lows.

Economic outlook 2026-2027 in advanced countries: Solidity test

After a year marked by global economic resilience and ending on a note of optimism, 2026 looks promising and could be a year of solid economic performance. In our baseline scenario, we expect most of the supportive factors at work in 2025 to continue to play a role in 2026.

Stellar Price Forecast: XLM slips below $0.22 as bearish momentum builds

Stellar (XLM) price is trading below $0.22 at the time of writing on Wednesday after failing to close above the key resistance earlier this week. Bearish momentum continues to strengthen, with open interest falling and short bets rising.