E.ON (EOAN Stock): Looking towards a strong rally

E.ON SE is a German electric utility company and by revenue one of the largest electric utility providers in the world. Created in 2000 through the merger of VEBA and VIAG and headquartered in Essen, Germany, the company operates in over 30 countries worldwide. E.ON is a part of both DAX30 and of SX5E indices. Even though the stock is considered as a highly attractive, the stock price has seen better times. As a matter of fact, it has not recovered after a strong decline from the all-time highs in 2008 at 44.10.
Now, a closer look on the price action of the stock provides insights on the further development. Indeed, from November 2016 lows one can observe already a second nest forming. Consequently, a strong rally higher should happen soon.
E.ON Monthly Elliott Wave Analysis 12.28.2020
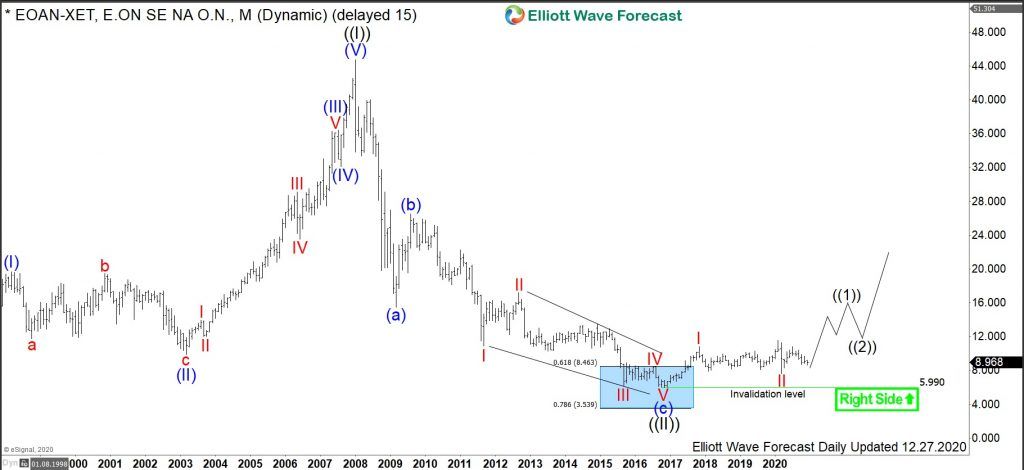
The monthly chart below shows the E.ON stock $EOAN traded at XETRA. From the all-time lows, the stock price has developed a cycle higher in black wave ((I)) of grand super cycle degree towards the all-time highs on January 2008 at 44.10. From the highs, a correction lower in black wave ((II)) has unfolded as an Elliott wave zigzag pattern. It has printed an important bottom on November 2016 at 5.99. From November 2012 lows, a new cycle in wave ((III)) has already started and should extend towards 44.10 highs and even higher.
A closer look on the price action from 2012 unveals the development of a base in price. Such basing – or nesting – action is usually a precursor for a following rally. From the 5.99 lows, E.ON demonstrates an advance in a red I wave towards November 2017 highs at 10.81. From there, a correction has unfolded as an expanded flat structure in wave II. The consolidation has ended in March 2020 at 7.60. While above there, E.ON should be already within wave III towards 10.81 highs and even higher. A target fo wave III will be 12.37-15.34 area.
E.ON Daily Elliott Wave Analysis 12.28.2020
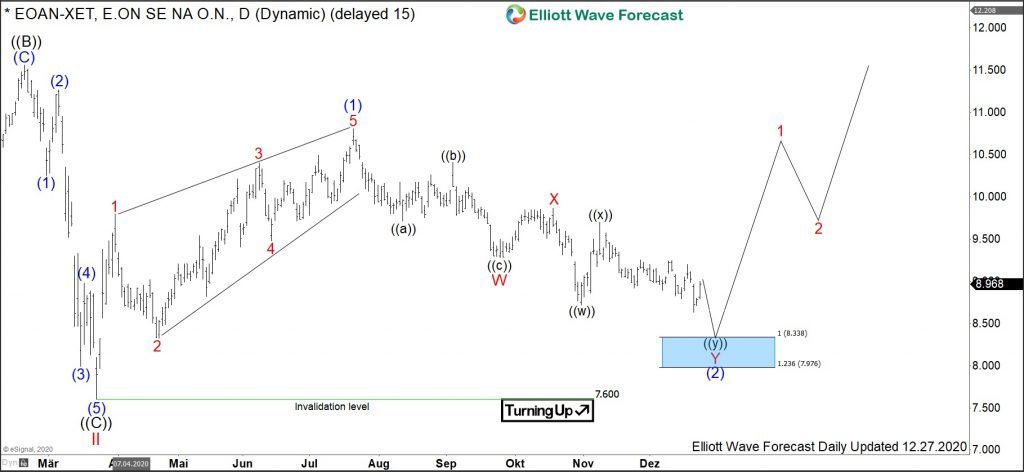
The daily chart below shows in more detail the first stages of the advance higher in wave III. From the March 2020 lows at 7.60, another nest is almost finished and another advance should happen soon. Hereby, blue wave (1) has developed a leading diagonal higher towards July 2020 highs at 10.81.
From the July 2020 highs, a double correction lower in wave (2) is in progress and should reach within red wave Y of blue wave (2) towards 8.338-7.976 area. There, one should be expecting the price to turn up again towards 10.81 and even higher.
Without any doubt, current stock price at 8.96 Euro does possess a high attractivity for investors. While above 7.60 lows, investors can anticipate E.ON to break above 10.81 targeting 12.37- 15.34 area. In a long run, E.ON should extend to the new all-time highs above 44.10.
Premium
You have reached your limit of 3 free articles for this month.
Start your subscription and get access to all our original articles.
Author

Elliott Wave Forecast Team
ElliottWave-Forecast.com


