|premium|

Elliott Wave view: ASANA Inc (ASAN Stock) should extend lower

ASANA Inc. (ASAN), operates a work management platform as Software services globally to get work done faster, while enhancing employee engagement by connecting to the mission of organization. It headquartered in San Francisco, California. It trades under the ticker name “ASAN” at NYSE & comes under Technology – Software application sector.

ASAN daily Elliott Wave analysis

ASAN made an impulse sequence higher as I red started from $20.57 low dated 11/12/2020, which proposed ended at $145.79 high on 11/15/2021. Thereafter the reaction lower was too sharp, which favors further weakness in correction of II before it resumes the next upside.

Chart

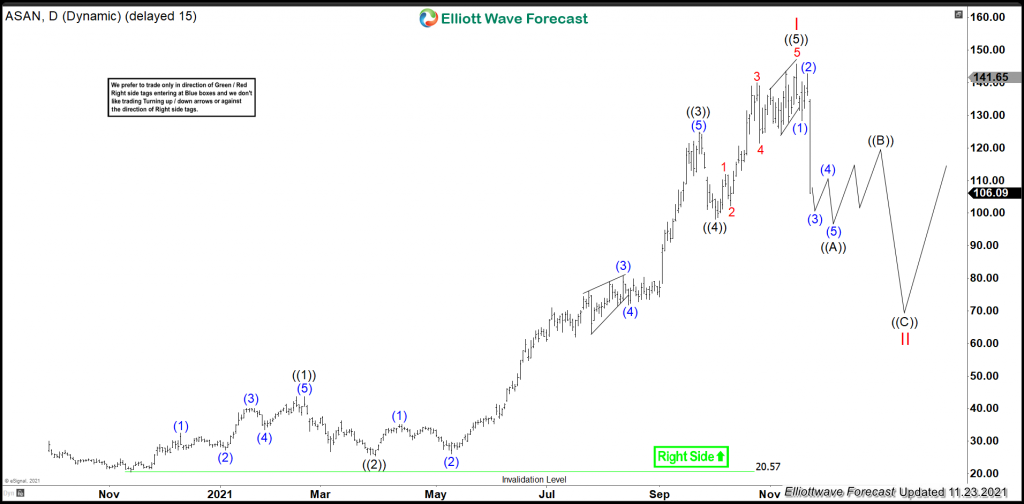
In daily, the all time low was at $20.57 on 11/12/2020. While above there it favored ended ((1)) at $43.72 high on 02/19/2021, while below there it placed ((2)) at $25.41 low on 03/30/2021. The correction of ((2)) was quite dip as 0.764 retracement against previous cycle. The wave ((3)) wave favored ended at $124.85 high on 9/23/2021 as third wave extension within third wave extension. The wave ((4)) favored ended at $98.06 low on 10/01/2021 low as shallow correction as 0.236 retracement of ((3)). The final leg higher favored ended at $145.79 high on 11/15/2021. While below there it favors the correction of II red lower.

Yesterday it dropped around 22%, which calls for short term weakness. In shorter cycle, it favors the (3) of ((A)) in progress & expect one more leg lower before it bounce in (4) followed by new low of (5) of ((A)). Thereafter it expects the bounce in ((B)) leg before further downside resumes towards equal leg area to end ((C)) of II.

Premium

You have reached your limit of 3 free articles for this month.

Start your subscription and get access to all our original articles.

Subscribe to PremiumSign In

Author

Elliott Wave Forecast Team

Elliott Wave Forecast Team

ElliottWave-Forecast.com

More from Elliott Wave Forecast Team
Share:

Editor's Picks

AUD/USD stays bid above 0.7100 on Australian trade data, Mideast optimism

AUD/USD clings to minor recovery gains above 0.7100 in the Asian session on Thursday as a new Israel-Lebanon ceasefire keeps a lid on the safe-haven US Dollar. Meanwhile, strong AustralianTrade Balane data also help the Aussie pair sustain the bounce from weekly lows.

USD/JPY hovers near the 160.00 intervention threshold on Mideast tensions

USD/JPY struggles to find acceptance above 160.00 and retreats from a one-month high in the Asian session on Thursday amid fears that authorities will step in again to prop up the Japanese Yen. Furthermore, a new Israel-Lebanon ceasefire caps the US Dollar and supports the currency pair. However, renewed US-Iran tensions keep the downside limited in the Greenback and the pair.

Gold rebounds from one-week low as Israel-Lebanon truce pressures safe-haven USD

Gold gains some positive traction on Thursday and climbs to the $4,475 area during the Asian session, reversing a major part of the previous day's slide to a one-week low. The Israel-Lebanon truce prompts some profit-taking around the US Dollar and supports the commodity. 


Ethereum: Long-term holders' capitulation drives ETH below $1,800

Ethereum has fallen below $1,800 on Wednesday, the first time since May 2025 following accelerated spot selling pressure and distributions from long-term holders. The Age Consumed metric, which tracks the movement of previously idle tokens or long-term holders' coins, spiked over the past two days as prices declined, indicating increased selling activity among this cohort.

Kevin Warsh takes the Fed helm: What it means for the US Dollar
The Federal Reserve moves away from the highly predictable "forward guidance" model of the Jerome Powell era to a new “Kevin Warsh environment”, characterized by less communication, more policy surprises, and an increased focus on the Fed's complex balance sheet.
Recession on paper: What really moves the Canadian Loonie now?

Statistics Canada handed the headline writers a gift and the analysts a headache. Real GDP shrank 0.1% on an annualized basis in the first quarter, and with the fourth quarter of 2025 revised down to a 1.0% contraction, that is two negative quarters in a row, the textbook definition of a technical recession and Canada's first since the pandemic.