Dow Jones Industrial Average pulls back from record highs, declines 350 point on Monday
- The Dow Jones shed roughly 350 points, or 0.8%, as equities retreat from record highs.
- Bullish momentum is taking a breather, with the Dow Jones bearing the brunt of the load.
- Earnings season expectations are battling with elevated interest rate fears.

The Dow Jones Industrial Average (DJIA) backslid on Monday, tumbling nearly 350 points and shedding eight-tenths of one percent as equity markets ease back from recent record highs. The Dow bore most of the bearish burden to kick off the new trading week, with losses consolidated largely within the major equity index.
Bond yields ticked higher and construction stocks swooned on the day, with fresh fears across the broader market that the Federal Reserve (Fed) would be forced to keep interest rates higher for longer. Despite delivering a jumbo rate cut of 50 bps in September, investors are balking at the fact that the US economy remains stubbornly resilient, implying it could take the Fed even longer than expected to finally drag core inflation down to the 2% annual target.
Earnings season is in full swing in equity markets, with roughly a fifth of the companies listed on the S&P 500 set to release Q3 revenue reporting through this week. A little under 20% of S&P 500 companies already reported third-quarter earnings last week, with nearly 80% of reporting companies beating Wall Street expectations. However, analysts have noted that the extreme beats come off the back of significantly downgraded expectations in recent months; with investing markets expecting so little, it’s difficult for firms to fail, with CFRA chief investment strategist Sam Stovall noting, “rarely does anybody injure themselves falling out of a basement window.”
Dow Jones news
Most of the securities listed on the Dow Jones are easing back on Monday, with all but five of the Dow’s constituent stocks seeing red for the day. Boeing (BA) rose over 3% to hit $160 per share ahead of the airline company’s earnings call slated for Wednesday, October 23. On the low side, American Express (AXP), Home Depot (HD), and Travelers Companies (TRV) lead the loser, with each decline over 2%. AXP fell 2.5% to $270 per share, with HD shedding 2.3% and falling below $405.50, and Travelers Companies declining 2.25%, falling below $260 per share in the process.
Dow Jones price forecast
The Dow Jones is giving mixed signals on daily candlesticks. Price action continues to grind deeper into bull country as bidding momentum outpaces long-term moving averages. However, technical indicators are going on the fritz after spending months flashing warning signs of overbought conditions.
The Dow backpedaled from a recent record high north of 43,200 set last Friday, testing back below 43,000 and shedding over 300 points. Despite the pullback, prices are pinned firmly on the high side, with the 50-day Exponential Moving Average (EMA) well below near-term price action at 41,740.
The Moving Average Convergence-Divergence (MACD) is currently above the zero line, a bullish signal, but the histogram shows a declining momentum. The fast MACD line is now close to crossing below the slower signal line, signaling that bearish momentum could soon take over. This could point to a short-term correction, especially if sellers manage to push the price below the 42,000 level.
Nonetheless, the MACD remains in positive territory with no decisive crossover observed yet, indicating that bulls still maintain some control. However, traders should monitor this indicator closely for additional confirmation of a possible bearish reversal.
Dow Jones daily chart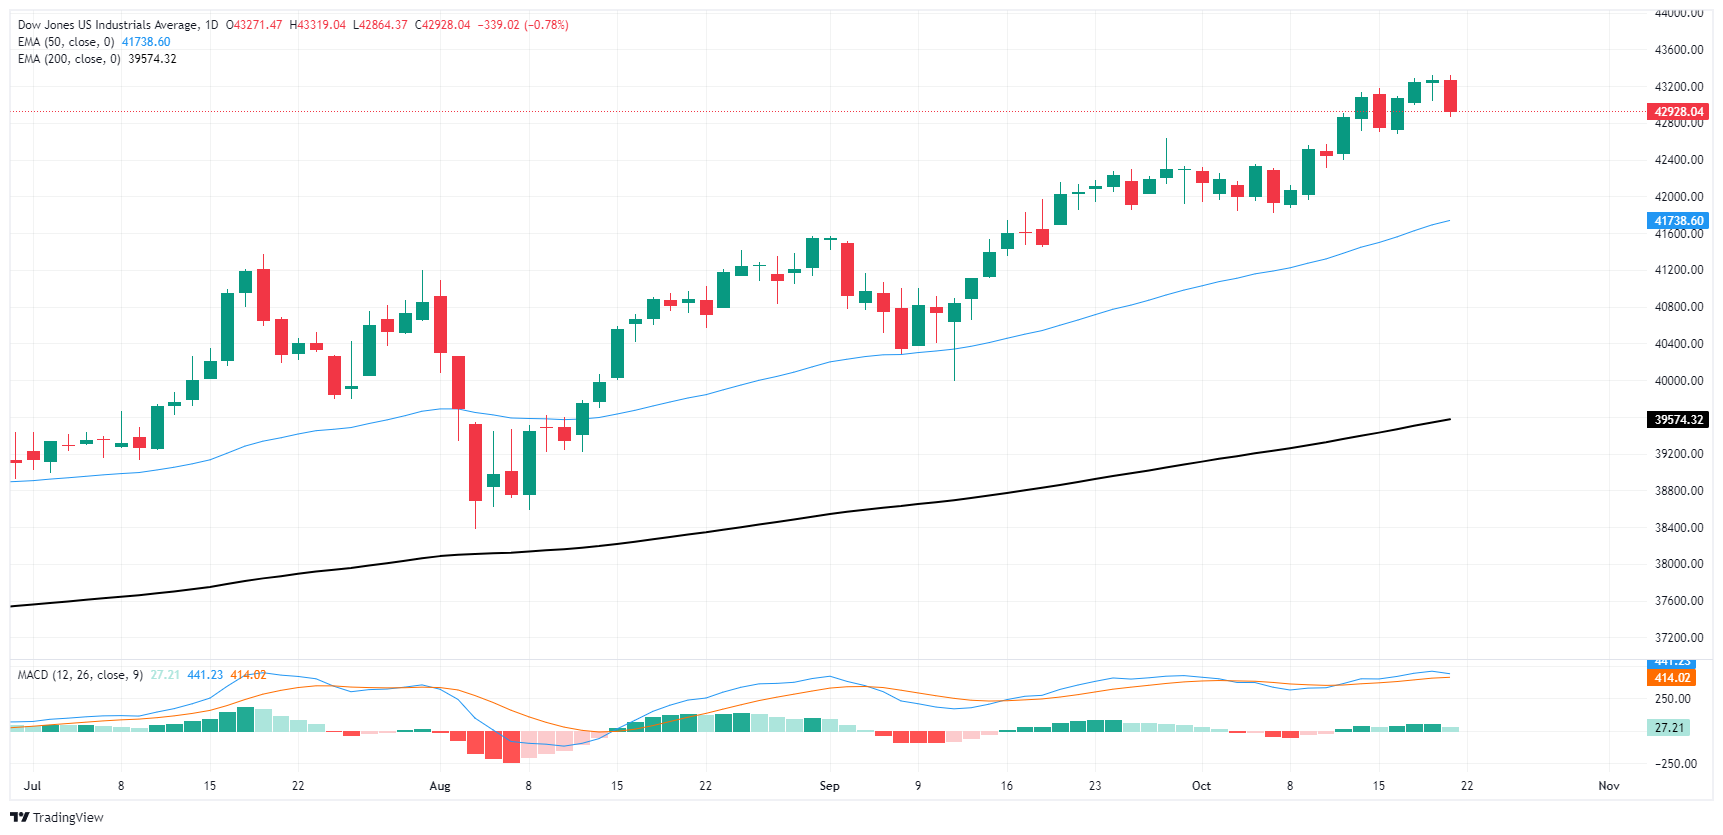
Dow Jones FAQs
The Dow Jones Industrial Average, one of the oldest stock market indices in the world, is compiled of the 30 most traded stocks in the US. The index is price-weighted rather than weighted by capitalization. It is calculated by summing the prices of the constituent stocks and dividing them by a factor, currently 0.152. The index was founded by Charles Dow, who also founded the Wall Street Journal. In later years it has been criticized for not being broadly representative enough because it only tracks 30 conglomerates, unlike broader indices such as the S&P 500.
Many different factors drive the Dow Jones Industrial Average (DJIA). The aggregate performance of the component companies revealed in quarterly company earnings reports is the main one. US and global macroeconomic data also contributes as it impacts on investor sentiment. The level of interest rates, set by the Federal Reserve (Fed), also influences the DJIA as it affects the cost of credit, on which many corporations are heavily reliant. Therefore, inflation can be a major driver as well as other metrics which impact the Fed decisions.
Dow Theory is a method for identifying the primary trend of the stock market developed by Charles Dow. A key step is to compare the direction of the Dow Jones Industrial Average (DJIA) and the Dow Jones Transportation Average (DJTA) and only follow trends where both are moving in the same direction. Volume is a confirmatory criteria. The theory uses elements of peak and trough analysis. Dow’s theory posits three trend phases: accumulation, when smart money starts buying or selling; public participation, when the wider public joins in; and distribution, when the smart money exits.
There are a number of ways to trade the DJIA. One is to use ETFs which allow investors to trade the DJIA as a single security, rather than having to buy shares in all 30 constituent companies. A leading example is the SPDR Dow Jones Industrial Average ETF (DIA). DJIA futures contracts enable traders to speculate on the future value of the index and Options provide the right, but not the obligation, to buy or sell the index at a predetermined price in the future. Mutual funds enable investors to buy a share of a diversified portfolio of DJIA stocks thus providing exposure to the overall index.
Author

Joshua Gibson
FXStreet
Joshua joins the FXStreet team as an Economics and Finance double major from Vancouver Island University with twelve years' experience as an independent trader focusing on technical analysis.


