Dow Jones Industrial Average bolstered after soft US PMI ignites risk appetite, tests 38,500
- Dow Jones tests 38,500.00 as US equities climb.
- US PMIs weakened, bolstering hopes for a Fed rate trim.
- Key US GDP and PCE inflation data still on the table for the week.

The Dow Jones Industrial Average (DJIA) climbed on Tuesday after US Purchasing Managers Index (PMI) figures softened unexpectedly, bringing broad-market hopes for an earlier-than-expected rate cut from the US Federal Reserve (Fed) back to the forefront.
The US Manufacturing PMI slid to a four-month low of 49.9 on Tuesday, slipping back from the previous 51.9. The Services PMI also declined, falling to 50.9 from 51.7. Both PMI components were expected to tick upwards to 52.0. With a softening PMI outlook, investors will watch US Gross Domestic Product (GDP) figures slated for Thursday.
The Fed’s favored method of gauging inflation, the Personal Consumption Expenditure (PCE) Price Index, will print on Friday to round out the trading week. Equities will look for further signs of slowing in the US domestic economy to gauge the likelihood of the Fed getting pushed into a rate cut cycle than currently expected.
US GDP is currently forecast to cool off to 2.5% for the first quarter on an annualized basis, while Friday’s Core PCE Price Index is expected to hold steady at 0.3% MoM in March.
Dow Jones news
Despite broad-market gains for US equities, the Dow Jones remained comparatively tepid relative to the other mega indexes, with the DJIA gaining around seven-tenths of a percent. Around a fifth of the 30 securities that comprise the Dow Jones index fell into the red on Tuesday, with Walmart Inc. (WMT) leading the losers. WMT closed down -1.75% on Tuesday, declining to $59.09 per share.
Verizon Communications Inc. (VZ) recovered from Monday’s downside, climbing 2.85% to trade at $39.70 per share. VZ is followed by American Express Co. (AXP), which gained 2.56% to trade just shy of $240.00 per share.
Dow Jones technical outlook
The Dow Jones tested the 38,500.00 handle on Tuesday, with the day’s early low priced in at 38,206.51. The major equity index gained 0.69% to close at 38,503.69 at the closing bell.
Tuesday’s upside close for the Dow Jones leaves the major index in the green for a third straight trading day as the index climbs from a near-term swing low around 37,600.00. The index is still down from March’s highs just shy of the 40,000.00 major handle, but the index is firmly bullish in the long-term. The Dow Jones is trading well above major technical support from the 200-day Exponential Moving Average (EMA) at 36,687.91.
Dow Jones five minute chart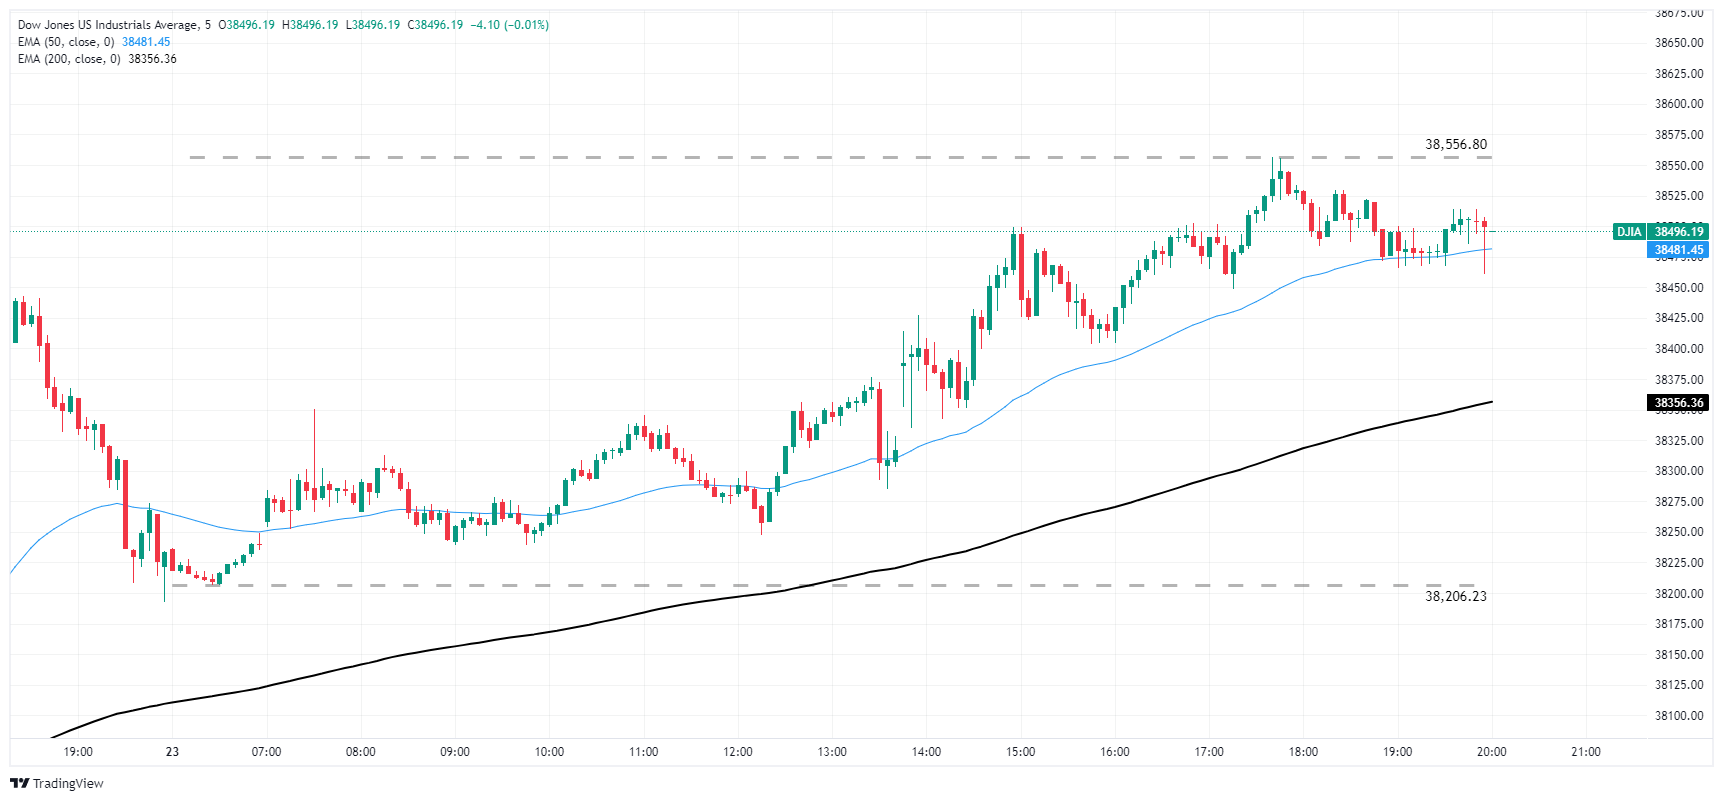
Dow Jones daily chart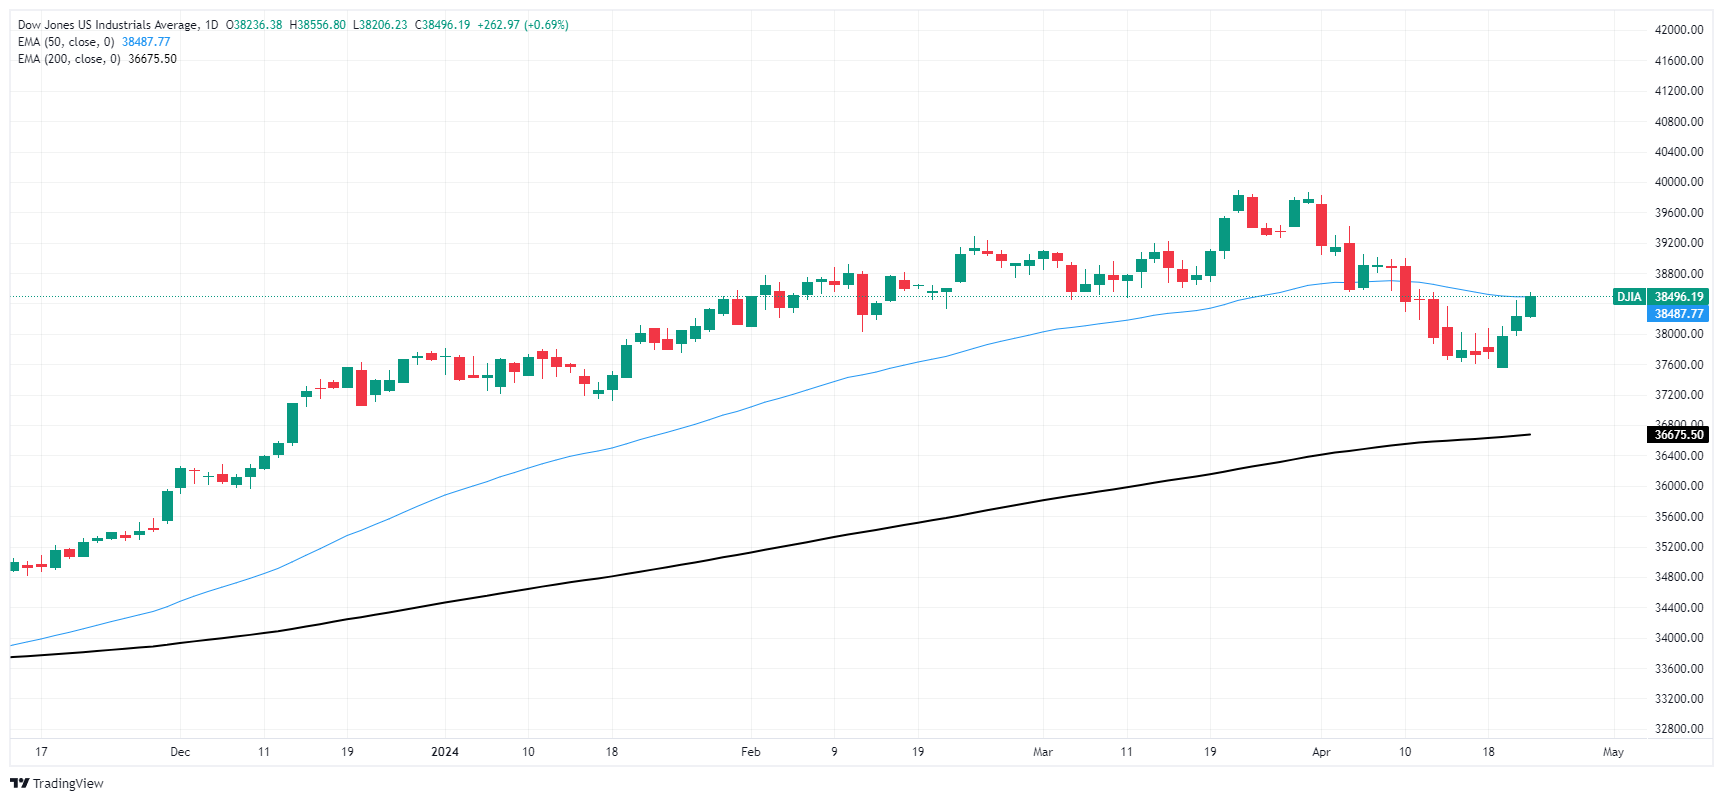
Dow Jones FAQs
The Dow Jones Industrial Average, one of the oldest stock market indices in the world, is compiled of the 30 most traded stocks in the US. The index is price-weighted rather than weighted by capitalization. It is calculated by summing the prices of the constituent stocks and dividing them by a factor, currently 0.152. The index was founded by Charles Dow, who also founded the Wall Street Journal. In later years it has been criticized for not being broadly representative enough because it only tracks 30 conglomerates, unlike broader indices such as the S&P 500.
Many different factors drive the Dow Jones Industrial Average (DJIA). The aggregate performance of the component companies revealed in quarterly company earnings reports is the main one. US and global macroeconomic data also contributes as it impacts on investor sentiment. The level of interest rates, set by the Federal Reserve (Fed), also influences the DJIA as it affects the cost of credit, on which many corporations are heavily reliant. Therefore, inflation can be a major driver as well as other metrics which impact the Fed decisions.
Dow Theory is a method for identifying the primary trend of the stock market developed by Charles Dow. A key step is to compare the direction of the Dow Jones Industrial Average (DJIA) and the Dow Jones Transportation Average (DJTA) and only follow trends where both are moving in the same direction. Volume is a confirmatory criteria. The theory uses elements of peak and trough analysis. Dow’s theory posits three trend phases: accumulation, when smart money starts buying or selling; public participation, when the wider public joins in; and distribution, when the smart money exits.
There are a number of ways to trade the DJIA. One is to use ETFs which allow investors to trade the DJIA as a single security, rather than having to buy shares in all 30 constituent companies. A leading example is the SPDR Dow Jones Industrial Average ETF (DIA). DJIA futures contracts enable traders to speculate on the future value of the index and Options provide the right, but not the obligation, to buy or sell the index at a predetermined price in the future. Mutual funds enable investors to buy a share of a diversified portfolio of DJIA stocks thus providing exposure to the overall index.
Author

Joshua Gibson
FXStreet
Joshua joins the FXStreet team as an Economics and Finance double major from Vancouver Island University with twelve years' experience as an independent trader focusing on technical analysis.


