Dollar Index Price Analysis: DXY takes out 11-month bearish trendline
- Dollar index's daily chart shows bullish reversal patterns.
- The breakout has opened the doors to resistance at 91.75.

The dollar index (DXY), which tracks the greenback's value against majors, has pierced the trendline falling from March 2020 highs, validating the reversal higher signaled by the inverse head-and-shoulders (H&S) breakout confirmed on Feb. 1.
The above-50 or bullish reading on the 14-day Relative Strength Index also indicates the path of least resistance is to the higher side.
As such, the DXY looks set to test resistance at 91.75 (Sept. 1 low). The outlook would turn bearish if the index finds acceptance under the former hurdle-turned-support of the inverse H&S neckline, currently at 90.90.
Daily chart
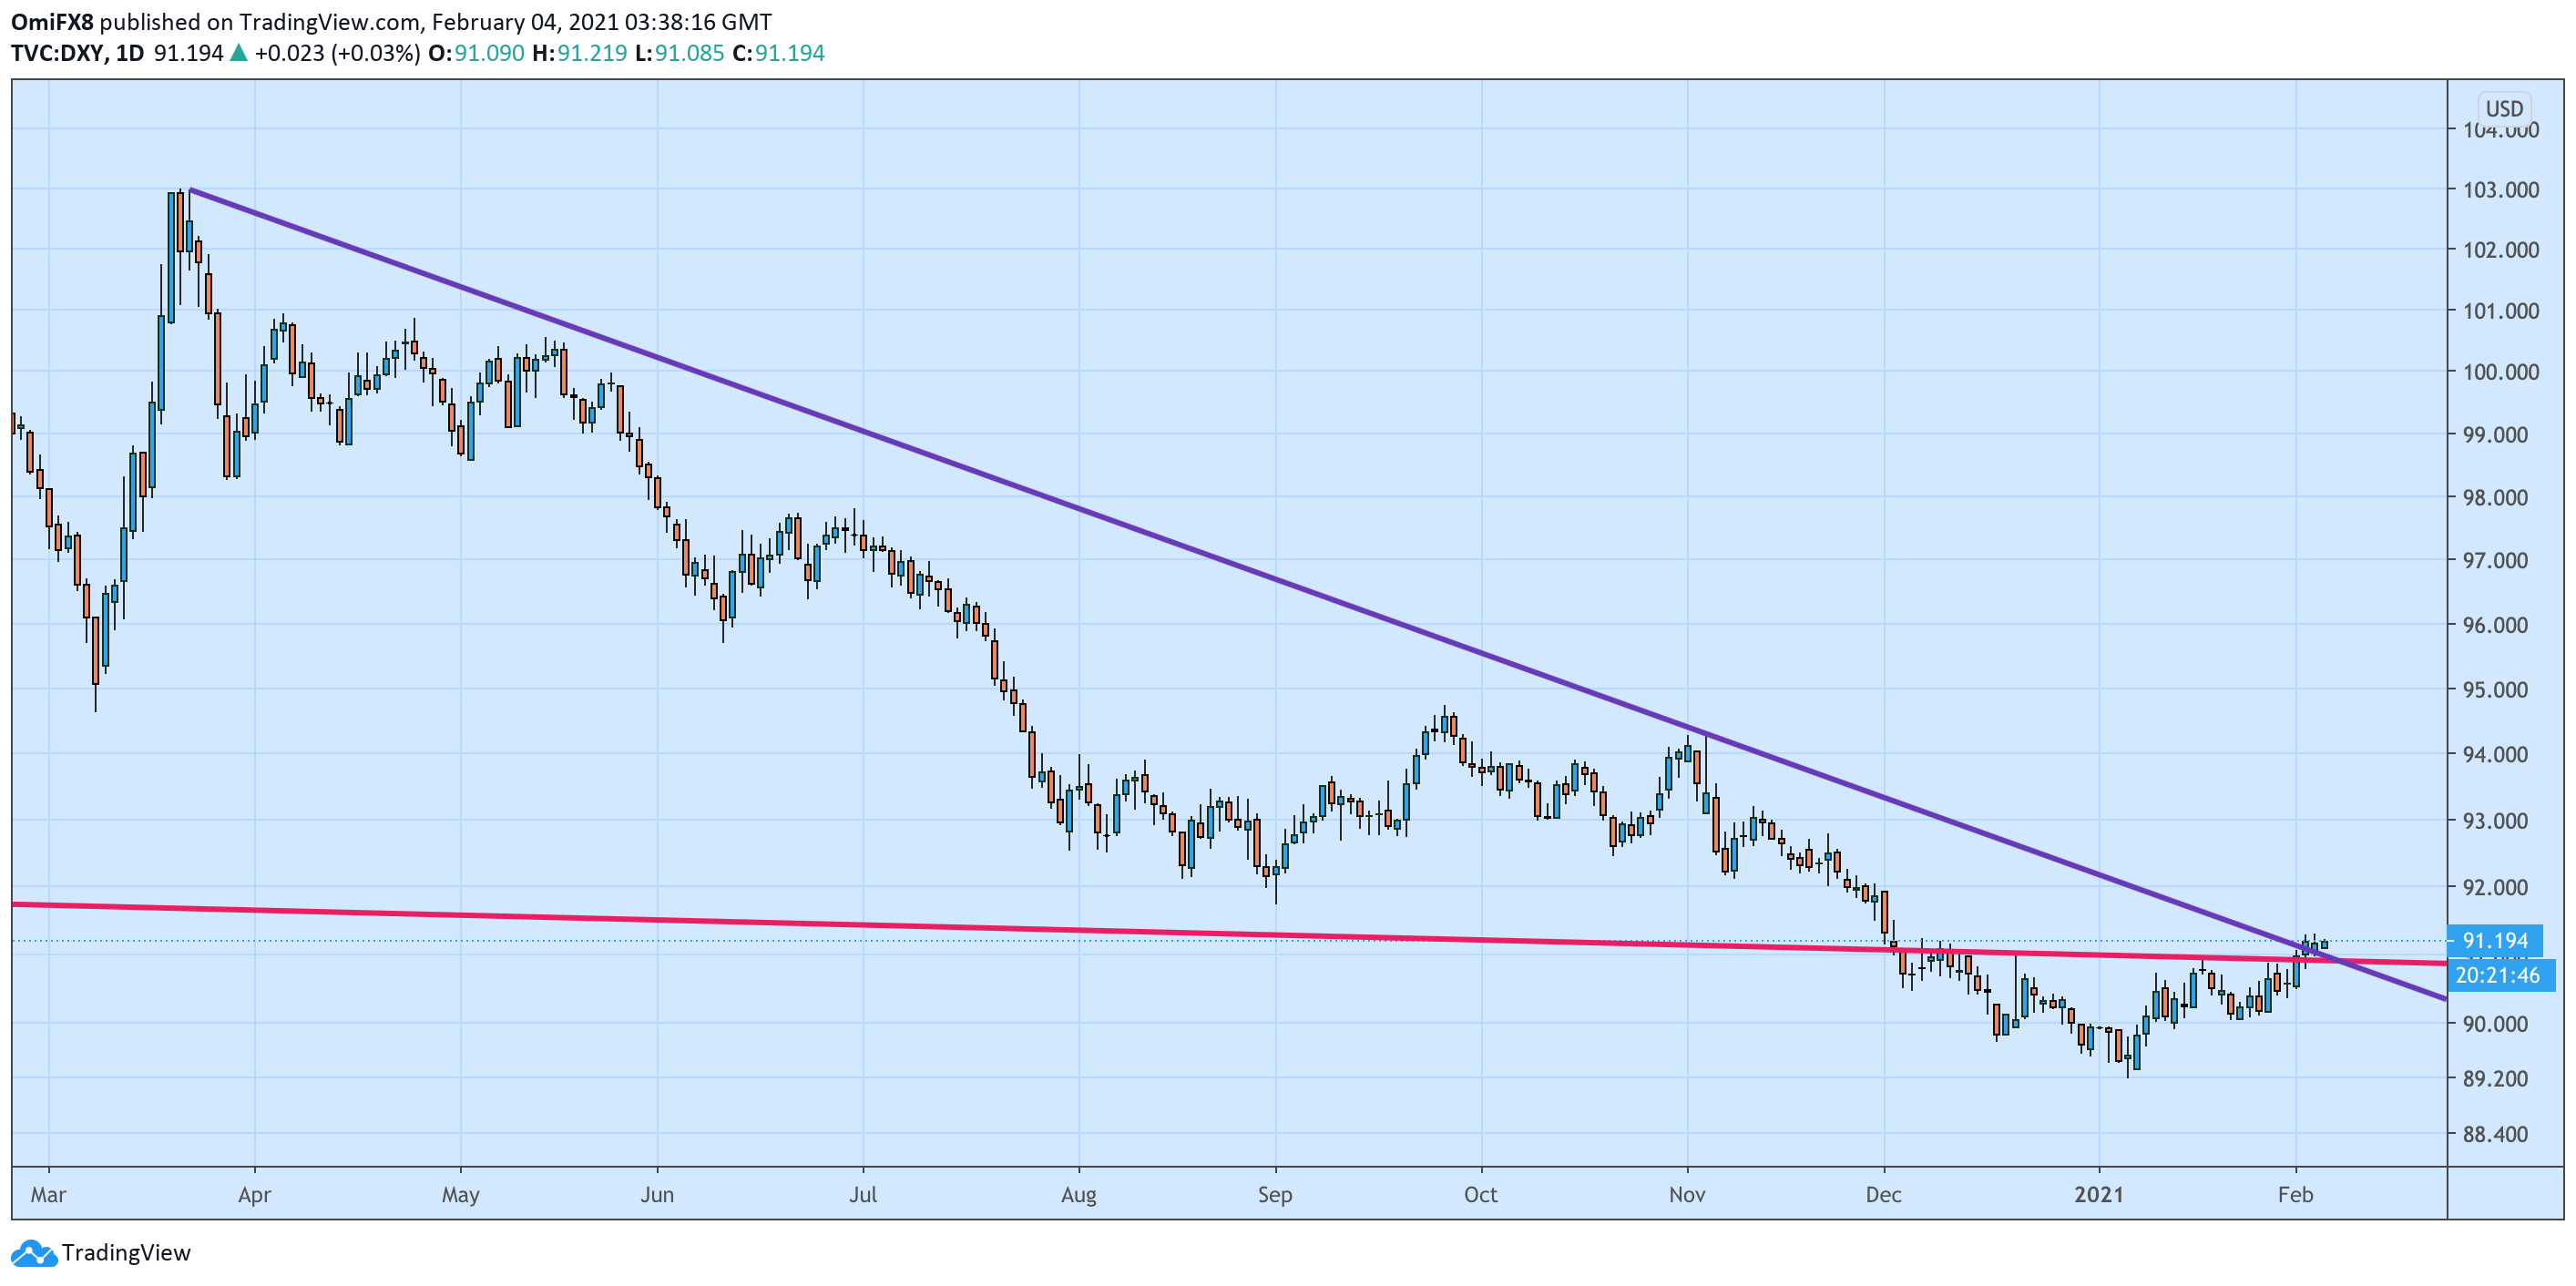
Trend: Bullish
Technical levels
Author

Omkar Godbole
FXStreet Contributor
Omkar Godbole, editor and analyst, joined FXStreet after four years as a research analyst at several Indian brokerage companies.


