Crude Oil staggers on Tuesday as bullish momentum gets cut short by EIA forecast shift
- EIA raises Crude Oil cost forecast on geopolitical concerns.
- WTI churns around $77.80 per barrel.
- OPEC cuts offset by record US Crude Oil production.

West Texas Intermediate (WTI) US Crude Oil has settled into a rough range on Tuesday, failing to capture $78.40 per barrel before falling into $77.20 as barrel traders struggle to pick a direction heading into the midweek. The Energy Information Administration (EIA) adjusted its outlook and forecasts on Tuesday, adding weight to the ongoing tensions from Houthi attacks in the Red Sea and an extension to production cuts from the Organization of the Petroleum Exporting Countries (OPEC).
According to the EIA, uncertainty around attacks on civilian cargo ships in the Red Sea by Iranian-backed Yemeni rebels will continue to build a risk premium into barrel prices. The EIA upped its forecast on Brent Crude Oil prices to average $87.00 per barrel, up over 5% from the previous month’s forecast of $82 per barrel. The EIA also expects the OPEC production cap extension to carry through the end of 2024, capping excess production capacity and propping up barrel prices.
On the other hand, US Crude Oil production continues to break records, with American oil pumping reaching an all-time high of 12.9 million barrels per day in 2023, the most Crude Oil produced by any country, ever. US Crude Oil now accounts for nearly 13% of all global production. In December alone, the US pumped 13.3 million bpd out of the ground. Ever-increasing US Crude Oil production could put a significant crimp in EIA forecasts on global production growth.
A steeper-than-expected decline in US Crude Oil stocks for the week ended March 8 from the American Petroleum Institute (API) saw a brief uptick in bullish momentum heading into the end of the American trading session. According to the API, US Weekly Crude Stocks declined by -5.5 million barrels, far below the forecast buildup of 400K barrels and the previous week's buildup of 423K. API data showed that gasoline stockpiles also declined by 3.75 million barrels, with distillate inventories sliding 1.16 million barrels. This marks the first time in almost six weeks that API Crude Stocks declined, and the largest draw since mid-January.
WTI technical outlook
WTI is testing into the low side on Tuesday after failing to capture $78.50 and facing technical rejections from the 200-hour Simple Moving Average (SMA) at $78.28. US Crude Oil is trading back from last week’s peak bids near $80.25, and WTI set a fresh near-term low on Monday around $76.50.
Crude Oil continues to churn chart paper, with WTI struggling to develop meaningful momentum in either direction as the 200-day SMA just shy of $78.00 per barrel keeps prices pinned into the midrange.
WTI hourly chart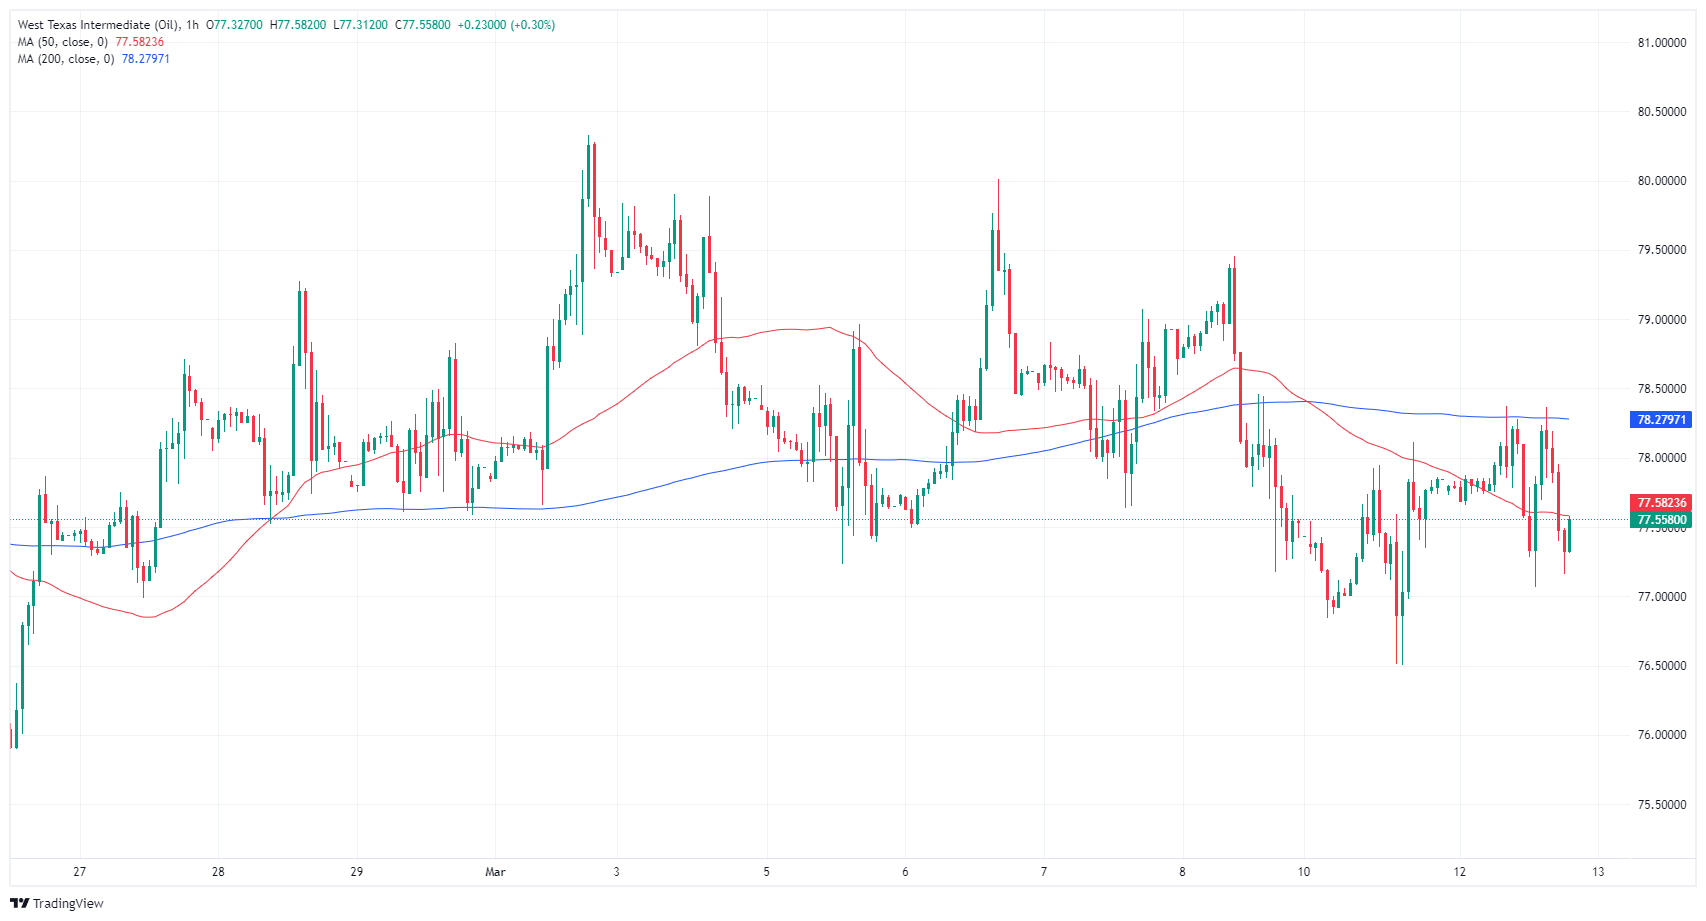
WTI daily chart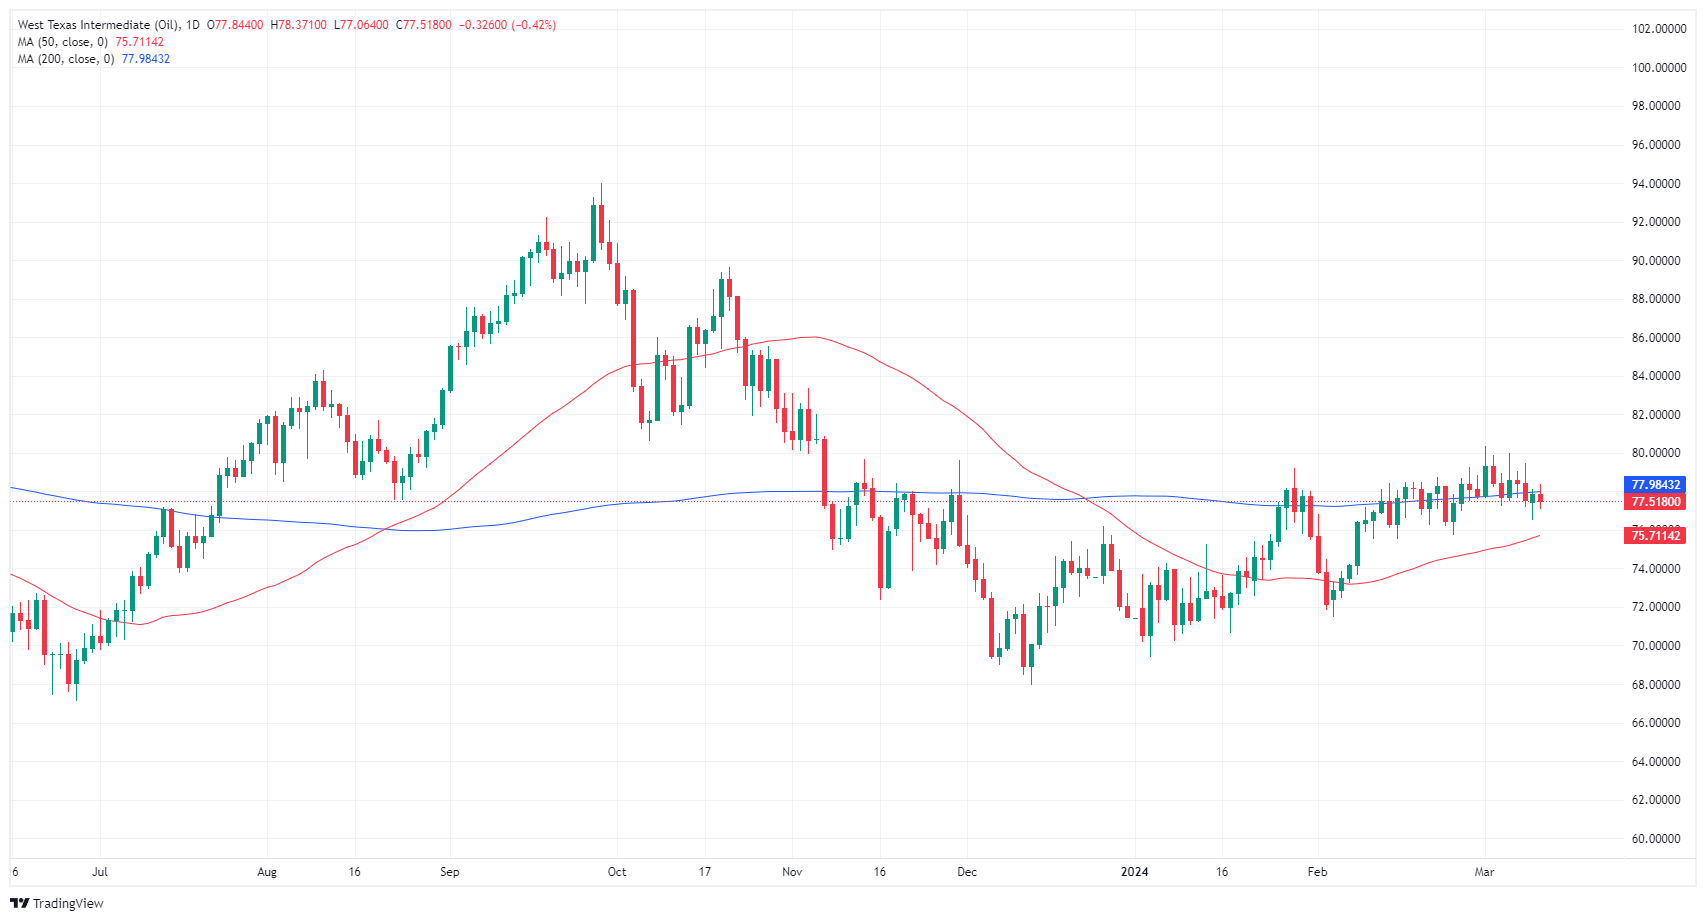
Author

Joshua Gibson
FXStreet
Joshua joins the FXStreet team as an Economics and Finance double major from Vancouver Island University with twelve years' experience as an independent trader focusing on technical analysis.


