- Crude Oil markets recovered after Wednesday’s decline as barrel bids rebound.
- WTI shrugs off warnings that global oil demand is set to peak according to the EIA.
- Crude Oil demand estimates have deviated wildly.
West Texas Intermediate (WTI) Crude Oil rebounded on Thursday, catching an upshot into $77.50 per barrel and slamming back into a technical congestion zone on the charts as energy market bid Crude Oil back up after a midweek pullback. Crude Oil supply lines saw an unexpected uptick in barrel counts this week, warning barrel traders that global supply continues to climb at a much faster pace than energy markets initially expected.
According to the International Energy Agency (IEA), global Crude Oil demand is going to settle into a much lower range than previously expected, with the IEA lowering its 2024 growth forecast. The IEA now expects global oil demand to grow by just 1.22 million barrels per day this year, down from the previous month’s estimate and coming in well below the forecast 2.25 million bpd growth forecast by the Organization for the Petroleum Exporting Countries (OPEC).
The IEA also expanded its projections for 2024’s production growth, forecasting global Crude Oil production to grow by 1.7 million bpd compared to the previous forecast of 1.5 million bpd. The IEA now expects global Crude Oil production will expand to a record 103.8 million barrels per day, fueled by production growth from non-OPEC entities, primarily the US.
Despite OPEC’s insinuation that they will be able to cut production enough to keep global crude markets constrained, the IEA expects demand for OPEC+ Crude Oil to continue to come in below current production targets.
WTI technical outlook
Thursday’s rebound in the WTI sees US Crude Oil climbing back into the 200-day Simple Moving Average (SMA) near $77.40 as WTI grinds its way back towards the $78.00 handle.
WTI is set to close once more in the green, offsetting Wednesday’s declines and putting US Crude Oil on pace to close higher for eight of the last nine consecutive trading days.
WTI hourly chart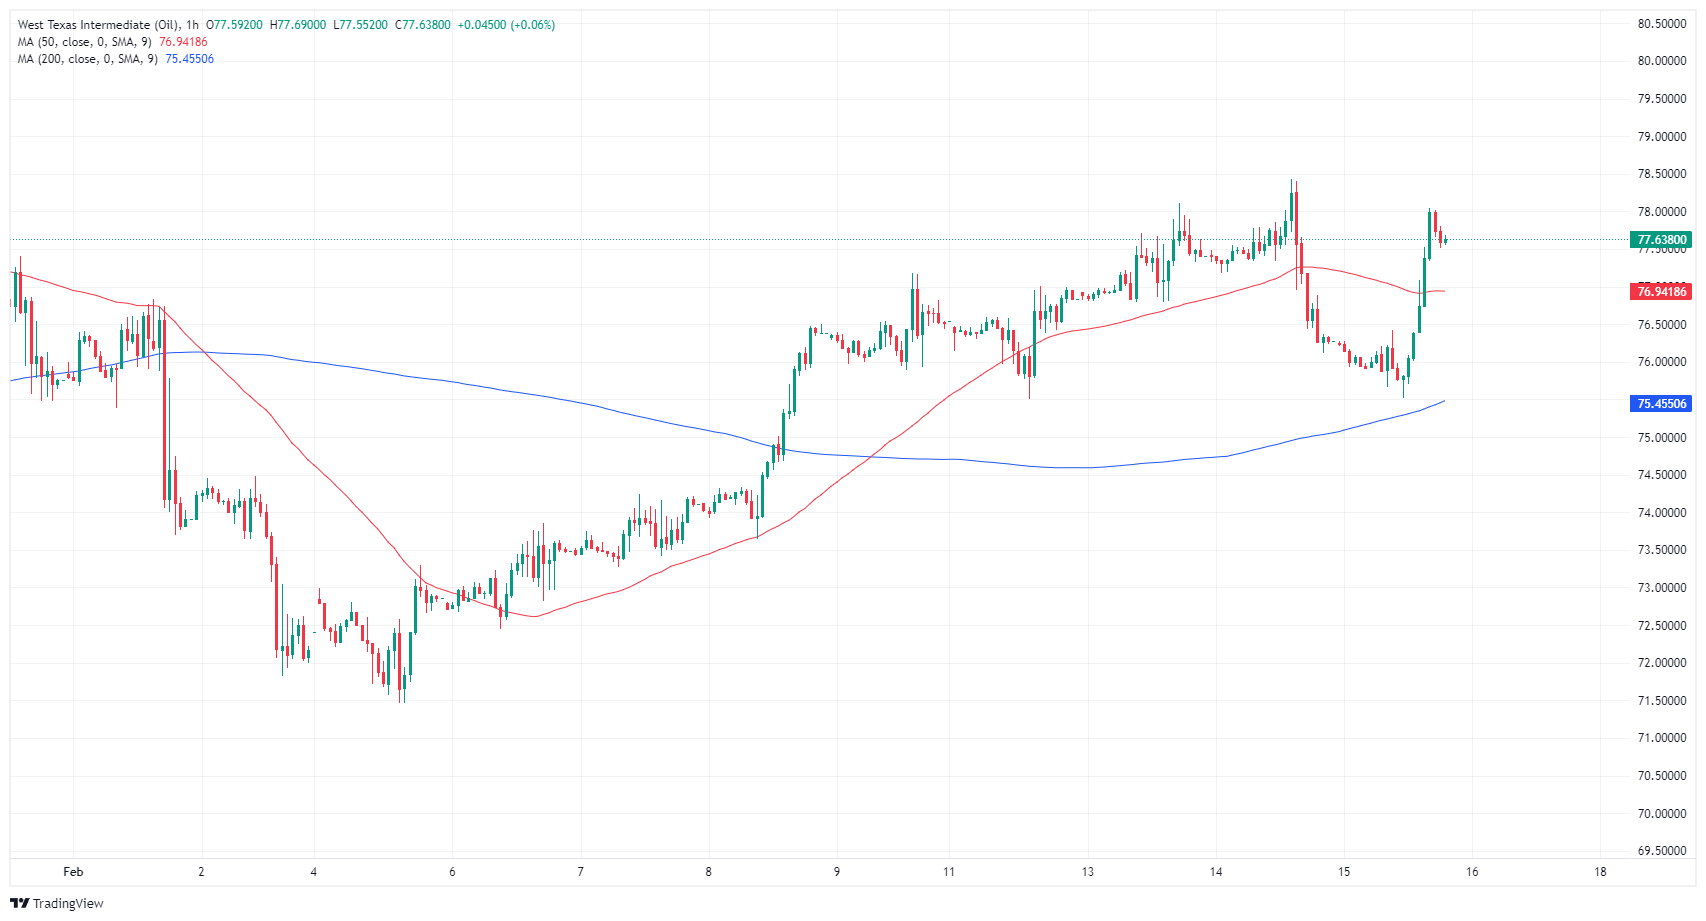
WTI daily chart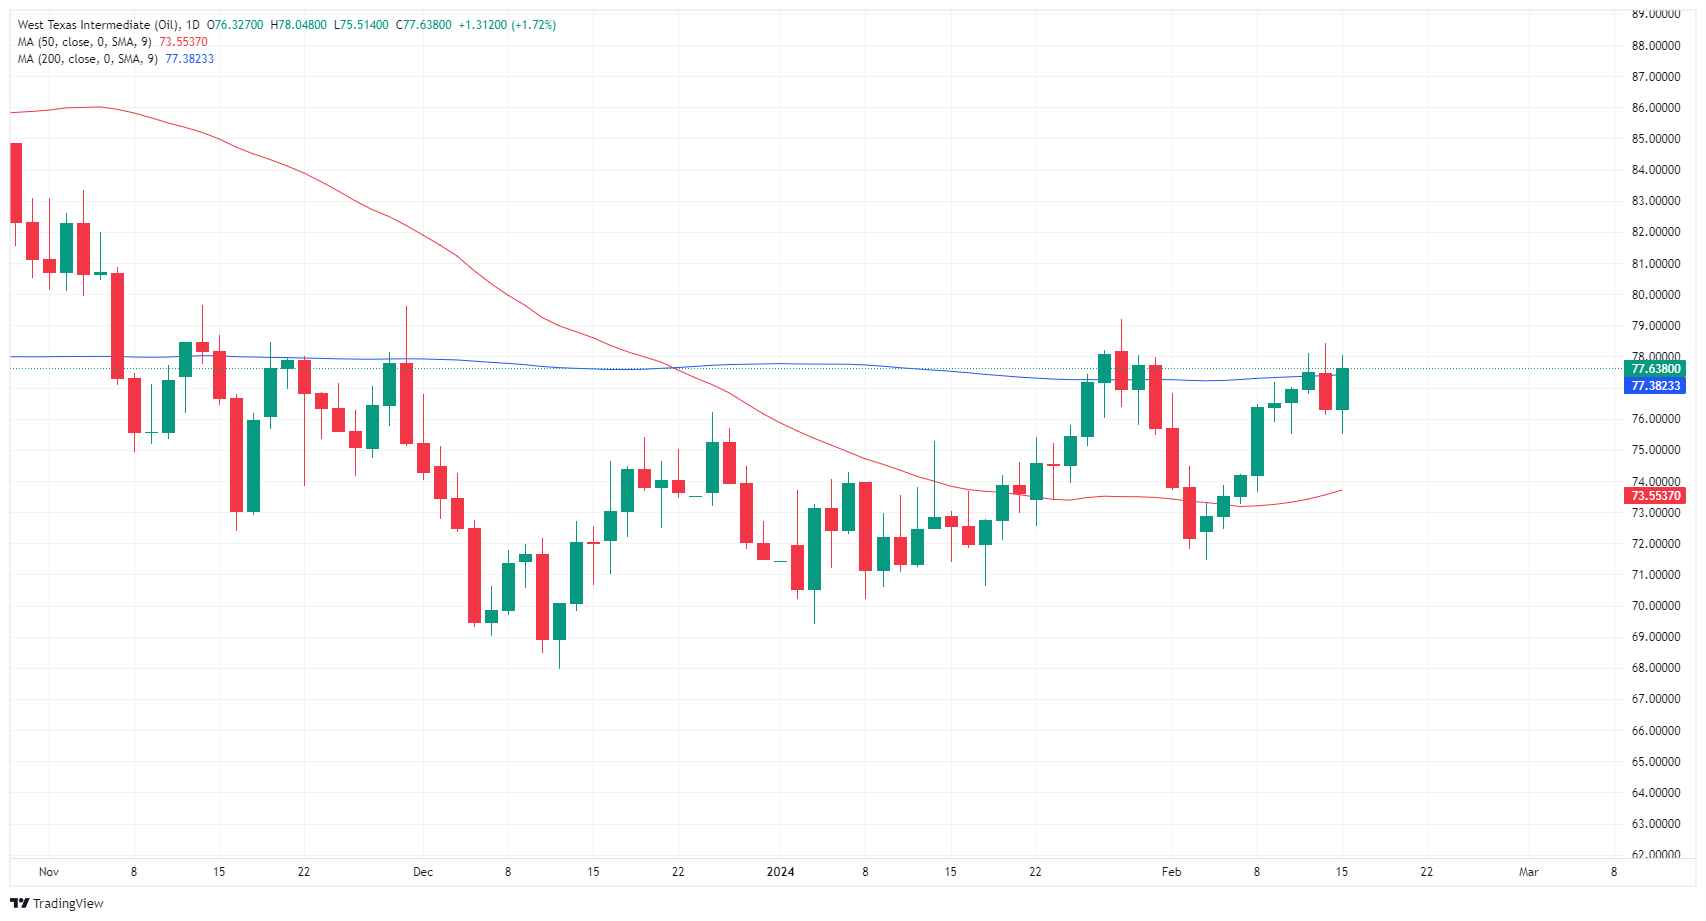
Information on these pages contains forward-looking statements that involve risks and uncertainties. Markets and instruments profiled on this page are for informational purposes only and should not in any way come across as a recommendation to buy or sell in these assets. You should do your own thorough research before making any investment decisions. FXStreet does not in any way guarantee that this information is free from mistakes, errors, or material misstatements. It also does not guarantee that this information is of a timely nature. Investing in Open Markets involves a great deal of risk, including the loss of all or a portion of your investment, as well as emotional distress. All risks, losses and costs associated with investing, including total loss of principal, are your responsibility. The views and opinions expressed in this article are those of the authors and do not necessarily reflect the official policy or position of FXStreet nor its advertisers. The author will not be held responsible for information that is found at the end of links posted on this page.
If not otherwise explicitly mentioned in the body of the article, at the time of writing, the author has no position in any stock mentioned in this article and no business relationship with any company mentioned. The author has not received compensation for writing this article, other than from FXStreet.
FXStreet and the author do not provide personalized recommendations. The author makes no representations as to the accuracy, completeness, or suitability of this information. FXStreet and the author will not be liable for any errors, omissions or any losses, injuries or damages arising from this information and its display or use. Errors and omissions excepted.
The author and FXStreet are not registered investment advisors and nothing in this article is intended to be investment advice.
Recommended content
Editors’ Picks
AUD/USD on the backfoot, slides below 0.6700

The Australian Dollar registered losses of 0.37% against the US Dollar on Monday, amid rising US Treasury yields that underpinned the Greenback. An upbeat market sentiment could not boost the high-beta Aussie Dollar, which tumbled below the 0.6700 figure. As the Asian session begins, the AUD/USD trades around 0.6668.
EUR/USD eased from 1.0880 on Monday as looming rate differential weighs

EUR/USD eased back from 1.0880 on Monday as talking points from Fed officials weighed on otherwise quiet market flows. Broader markets are keenly anxious for signs of a rate cut from the Fed, but central planners continue to force down expectations with a tricky inflation outlook hobbling the Fed’s options on rate moves.
Gold price retreats after hitting record high at $2,450

Gold price extended its gains on Monday, yet it trades slightly below the all-time high of $2,450 reached during the Asian session amid increasing expectations that major central banks, including the Federal Reserve, might ease policy during 2024.
Digital asset weekly inflows jump over 600% following response to CPI report

Coinshares weekly report of digital asset flows shows that crypto assets witnessed more than a 600% increase in net inflows last week after US Consumer Price Index saw a softer-than-expected inflation increase.
Will the commodity boom last?

The gold and copper price both hit fresh record highs on Monday. The market is sensitive to these two metals because gold is considered an inflation hedge and a safe haven, and because copper is a metal that is linked to global growth.