Crude Oil flattens on Thursday, WTI tests below $78.00
- Crude Oil capped after US stocks increase.
- US PCE print limits risk appetite.
- Geopolitical headline tension is easing slightly.

West Texas Intermediate (WTI) US Crude Oil traded closely with the $78.00 handle on Thursday as bullish Crude Oil momentum stopped in its tracks as rising US Crude Oil stocks begin to weigh on energy risk appetite. US Personal Consumption Expenditure (PCE) inflation came in at expectations but failed to spark renewed hopes for Federal Reserve (Fed) rate cuts.
US Crude Oil barrel counts from both the Energy Information Administration (EIA) and the American Petroleum Institute (API) this week saw additional Crude Oil reserves added to US supply lines. A steady buildup of barrel counts on the back of record Crude Oil production from the US is limiting upside potential in WTI, which has struggled to hold onto bullish territory after failing to capture the $79.00 handle
Geopolitical headline pressures from the Middle East have eased as markets await the outcome of renewed negotiations for a ceasefire in the ongoing Gaza conflict between Israel and Palestinian Hamas.
US PCE inflation printed at market expectations on Thursday, but the Fed’s preferred inflation metric still sees inflation too high for the FEd to be pushed into rate cuts sooner rather than later, and broad-market risk appetite eased back in the back half of the trading week.
WTI technical outlook
WTI has been trapped in heavy near-term consolidation, with intraday action cycling between $78.80 and $77.80 heading into the Friday market session.
Near-term technicals continue to find support at the $77.60 level, and the week’s high of $79.27 failed to kick off further gains.
Daily candles are caught in tight churn at the 200-day Simple Moving Average (SMA) as Crude Oil bids pull into the middle of long-term median prices.
WTI hourly chart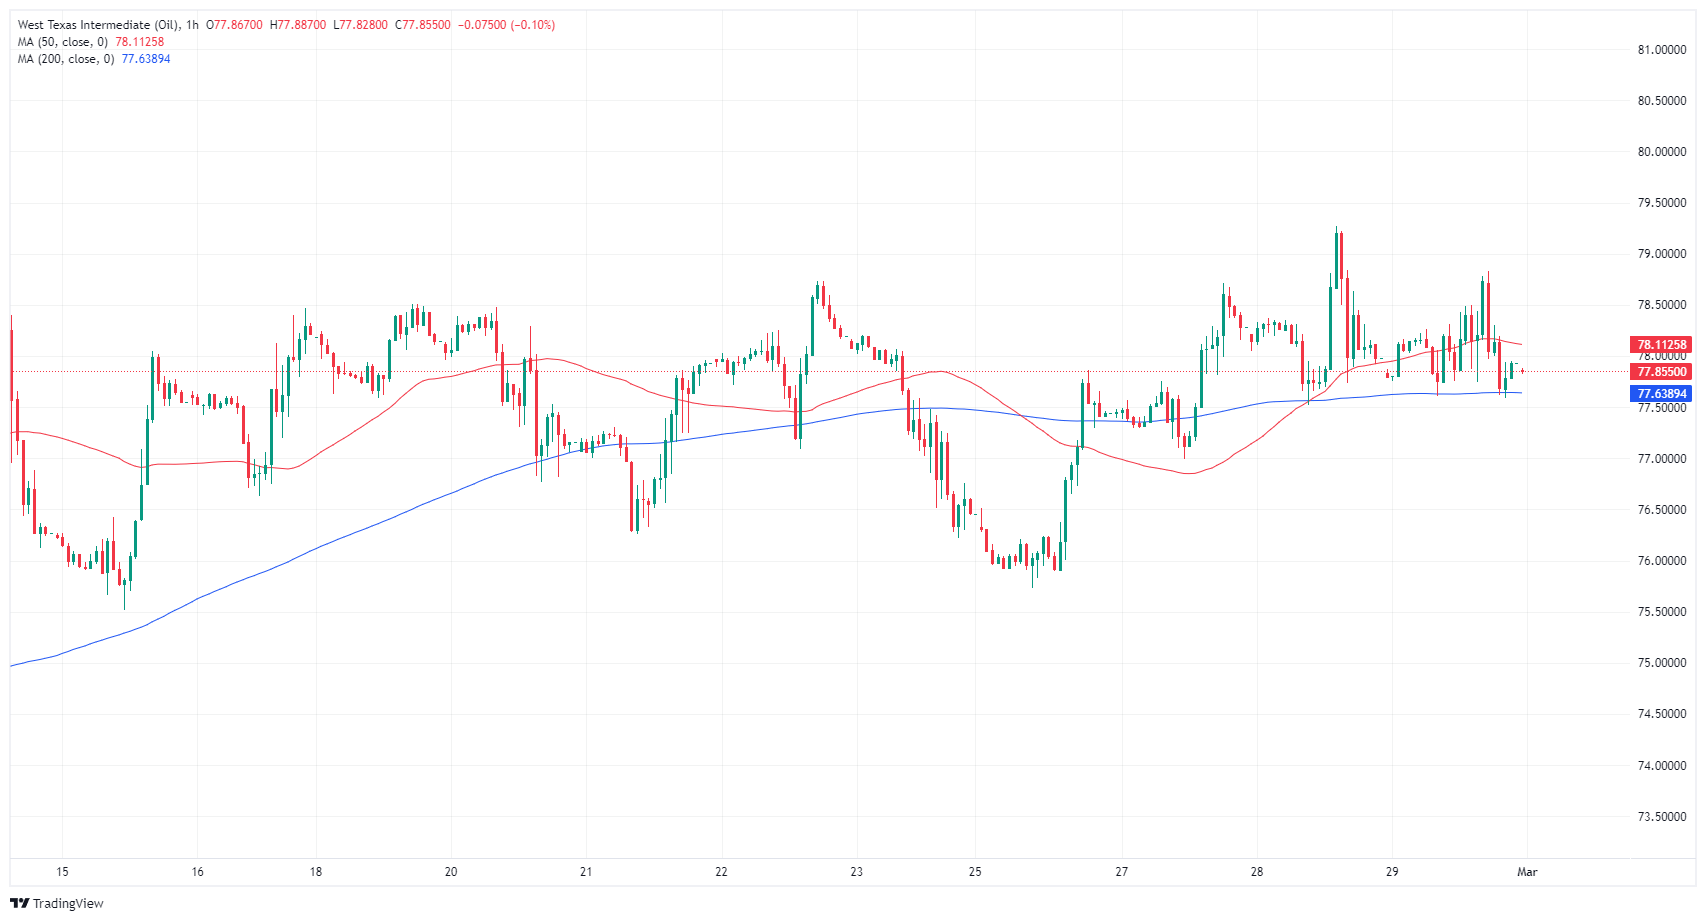
WTI daily chart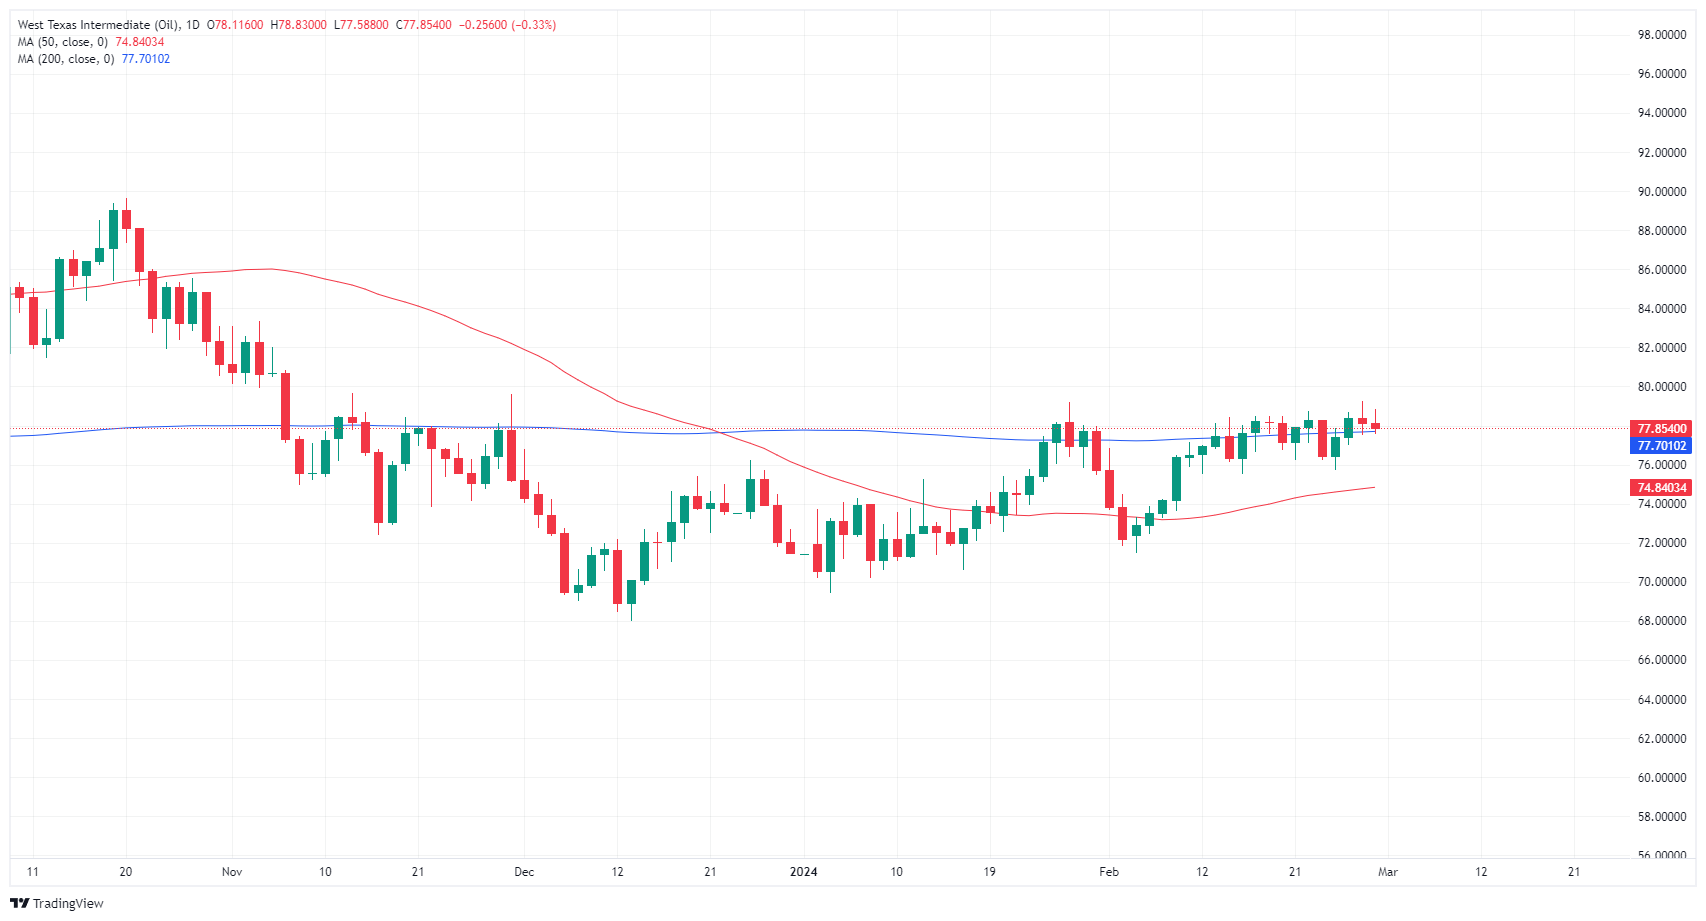
Author

Joshua Gibson
FXStreet
Joshua joins the FXStreet team as an Economics and Finance double major from Vancouver Island University with twelve years' experience as an independent trader focusing on technical analysis.


