Crude Oil dips then recovers on Thursday after US supplies draw down, China demand picks up
- US Crude Oil stocks rose less than expected this week.
- China saw an uptick in Crude Oil demand.
- Market shrugs off more productive US Crude Oil well efficiency.

West Texas Intermediate (WTI) fell towards $77.60 per barrel early Thursday before a firm rally in the US trading session dragged US Crude Oil back into the high end for the day. US Crude Oil supplies rose less than expected this week, and a drawdown in US gasoline reserves is propping up hopes of demand outrunning supply.
China’s Crude Oil imports rose over 5% in January and February according to Chinese government data published on Thursday. The Lunar New Year holiday saw Chinese demand for fuel surge as holiday travel bolstered consumption.
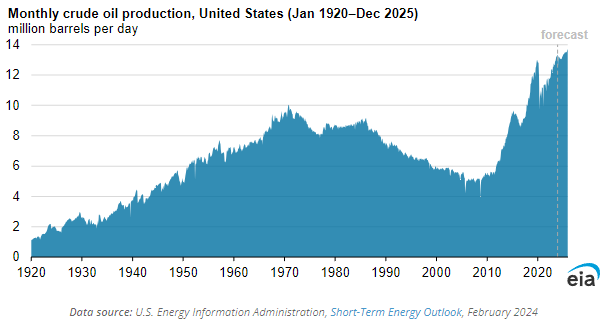
US Crude Oil production continues to rise into record levels, and according to the Energy Information Administration (EIA), that trend is set to continue. As noted by the EIA, increasing efficiency in already-existing US Crude OIl production facilities is driving the total output volume into higher numbers despite a bearish outlook on the total number of production facilities. Counts on US oil rigs are steadily decreasing and the number of new wells being produced has been easing for over a decade.
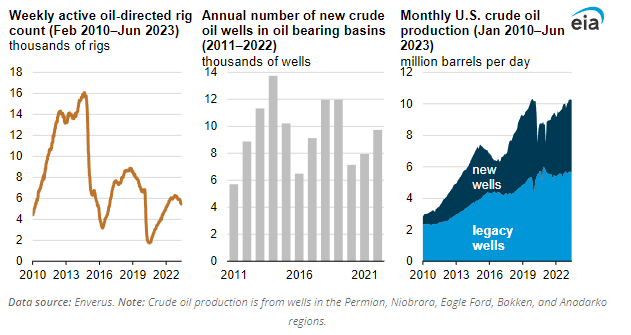
However, previously built or “legacy” wells continue to produce higher amounts of Crude Oil as the US energy market becomes increasingly efficient.
WTI technical outlook
WTI’s near-term churn keeps US Crude Oil bids trapped in a rough range with the $80.00 handle acting as a technical ceiling, and Thursday’s rebound has WTI struggling to etch in chart paper above $79.00.
Daily candlesticks are stuck in a close pattern with the 200-day Simple Moving Average (SMA) near $77.90. US Crude Oil has risen around 10% from early February’s swing low into $71.50, but further topside moment has drained out of WTI.
WTI hourly chart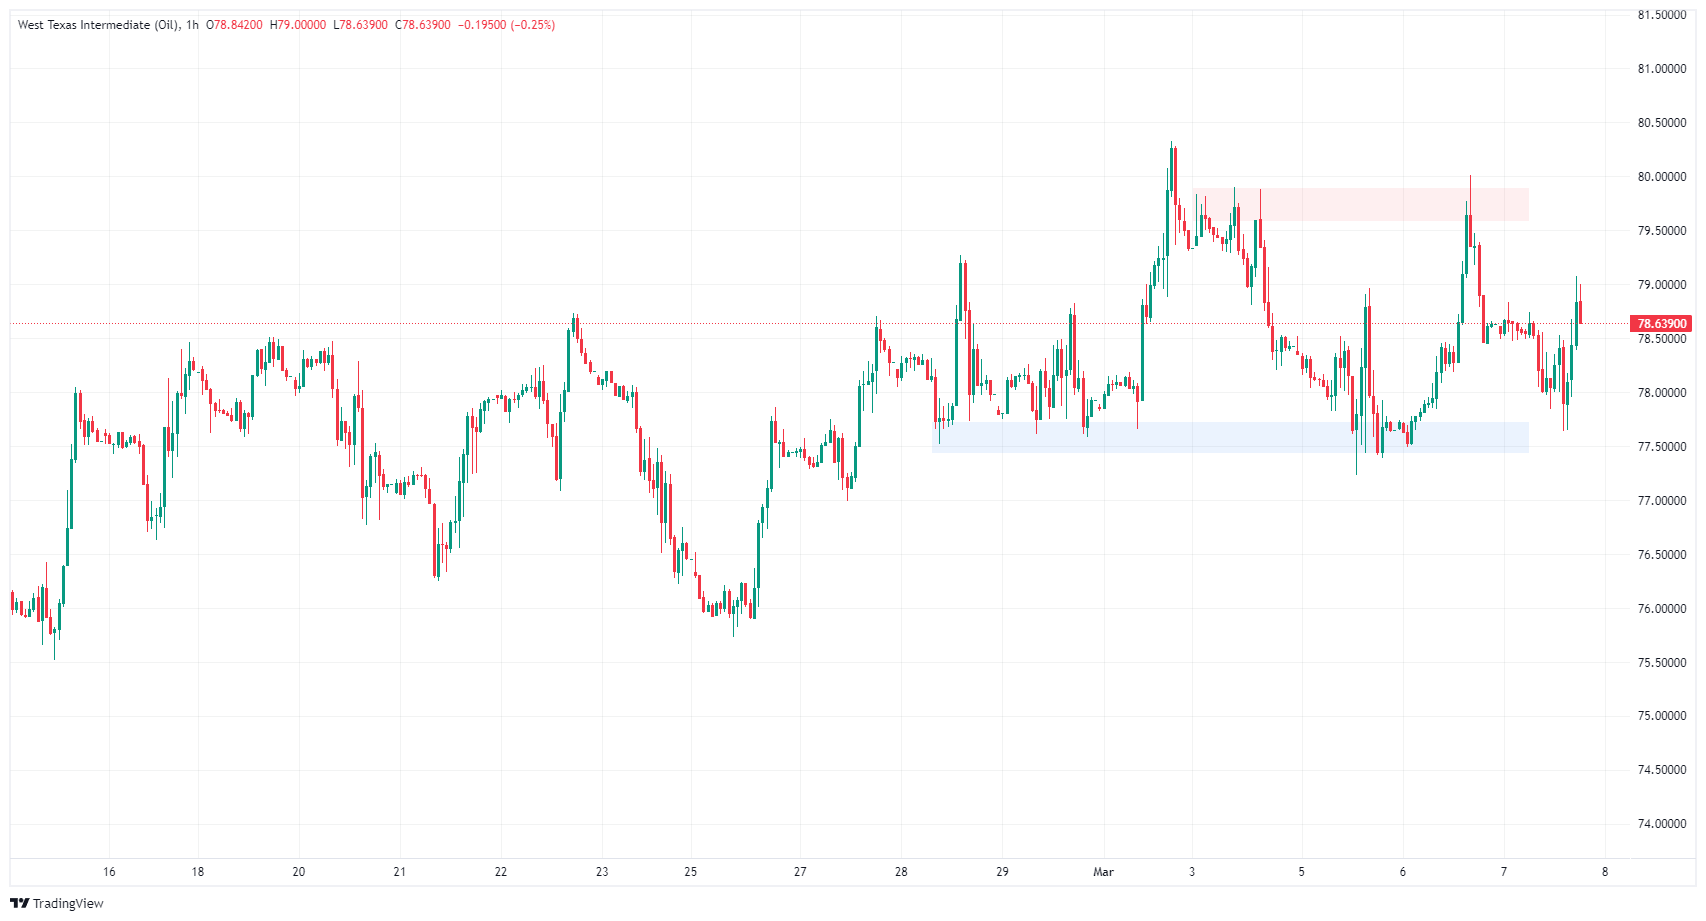
WTI daily chart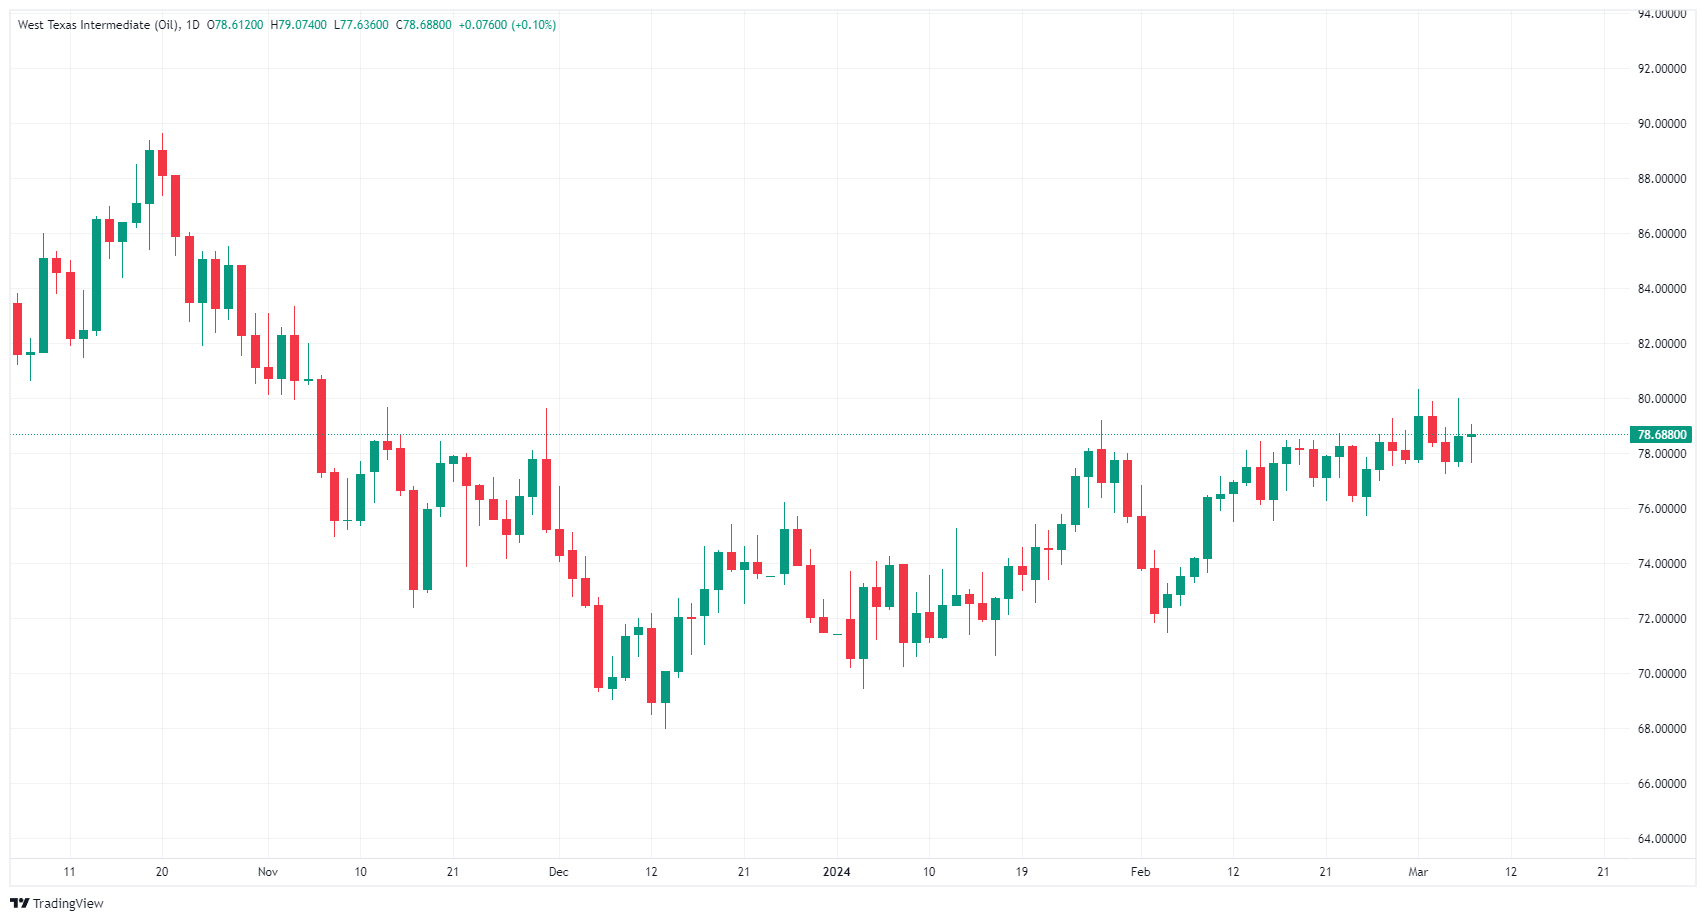
Author

Joshua Gibson
FXStreet
Joshua joins the FXStreet team as an Economics and Finance double major from Vancouver Island University with twelve years' experience as an independent trader focusing on technical analysis.


