Can US indices sustain the upside momentum after Fridays NFP?
Overview
US index futures have started the week on the front foot after a better-than-expected US Jobs report on Friday (Non-farm payrolls July exp. +250k act. +528K).
The markets are now drawn towards a 75 basis-point rate hike in September. Will this result in a dampening of the US stock market rally?
Technical:
I want to bring your attention to three major US Stock Indices
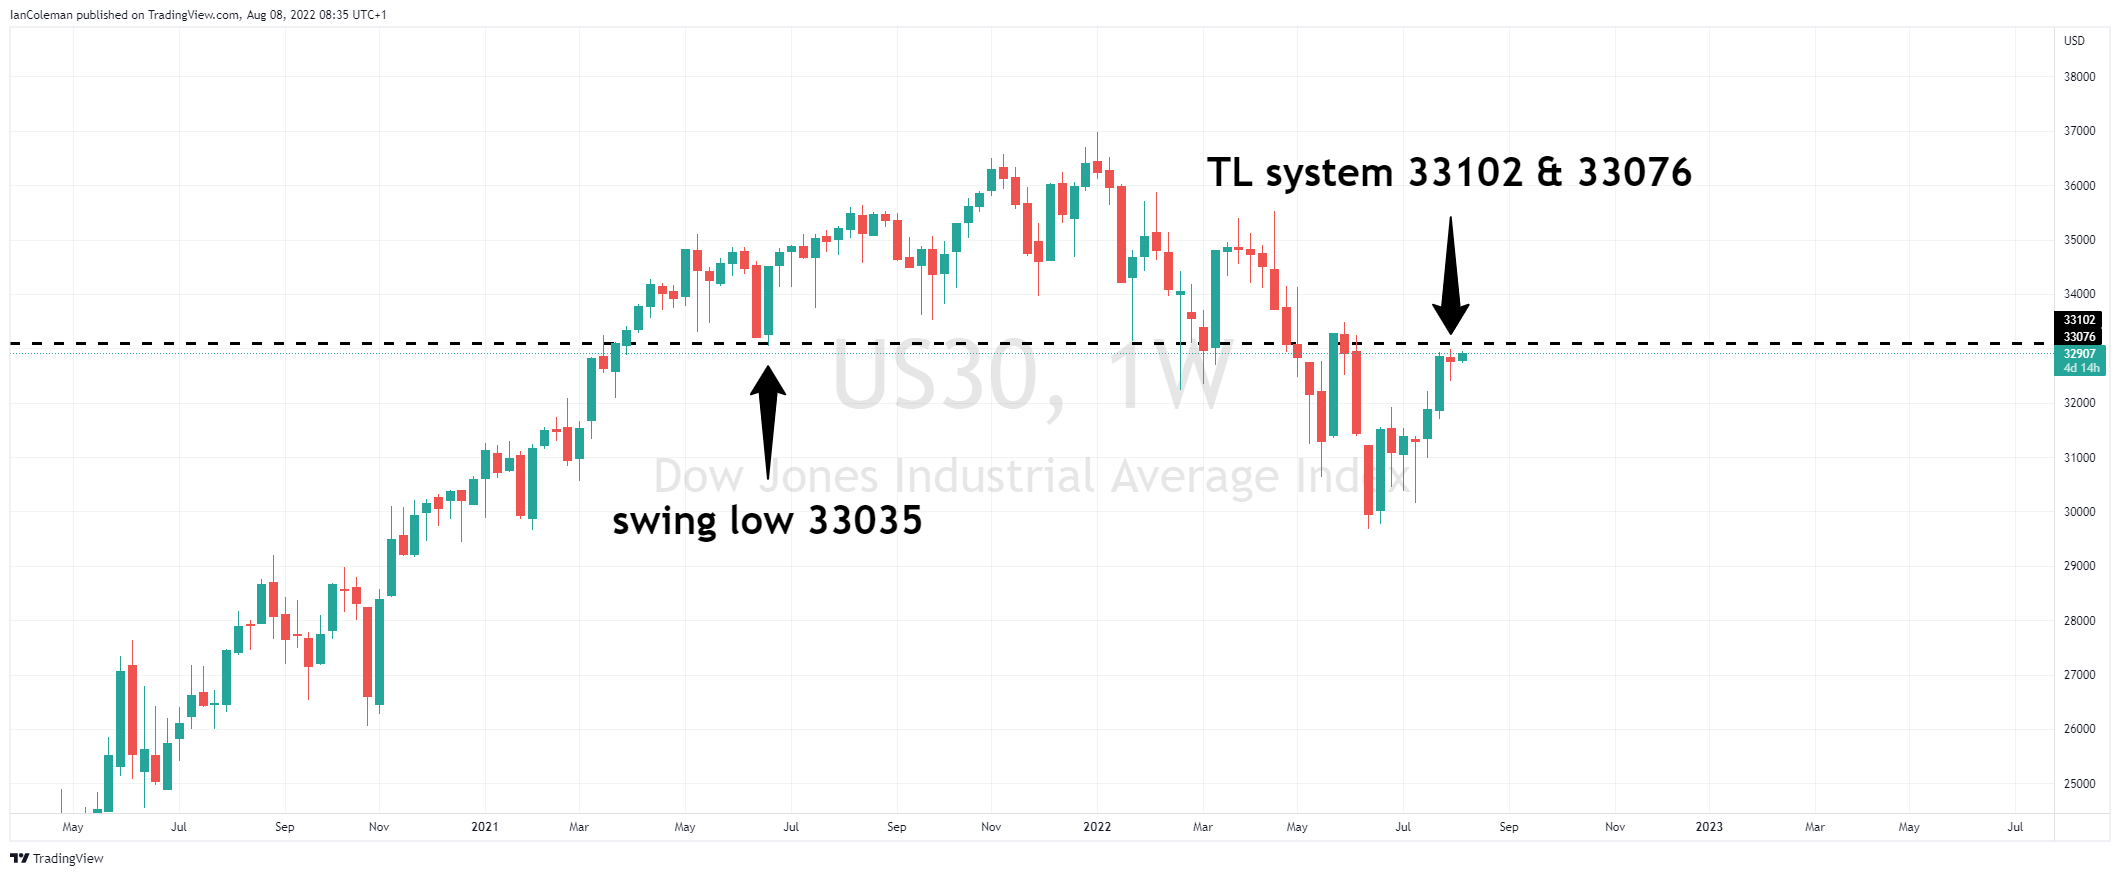
US30 weekly chart
US30 posted a swing low of 33035 on the week 21st of June 2021. What was support, now becomes resistance. The TL system highlights bespoke resistance between 33076 and 33102.
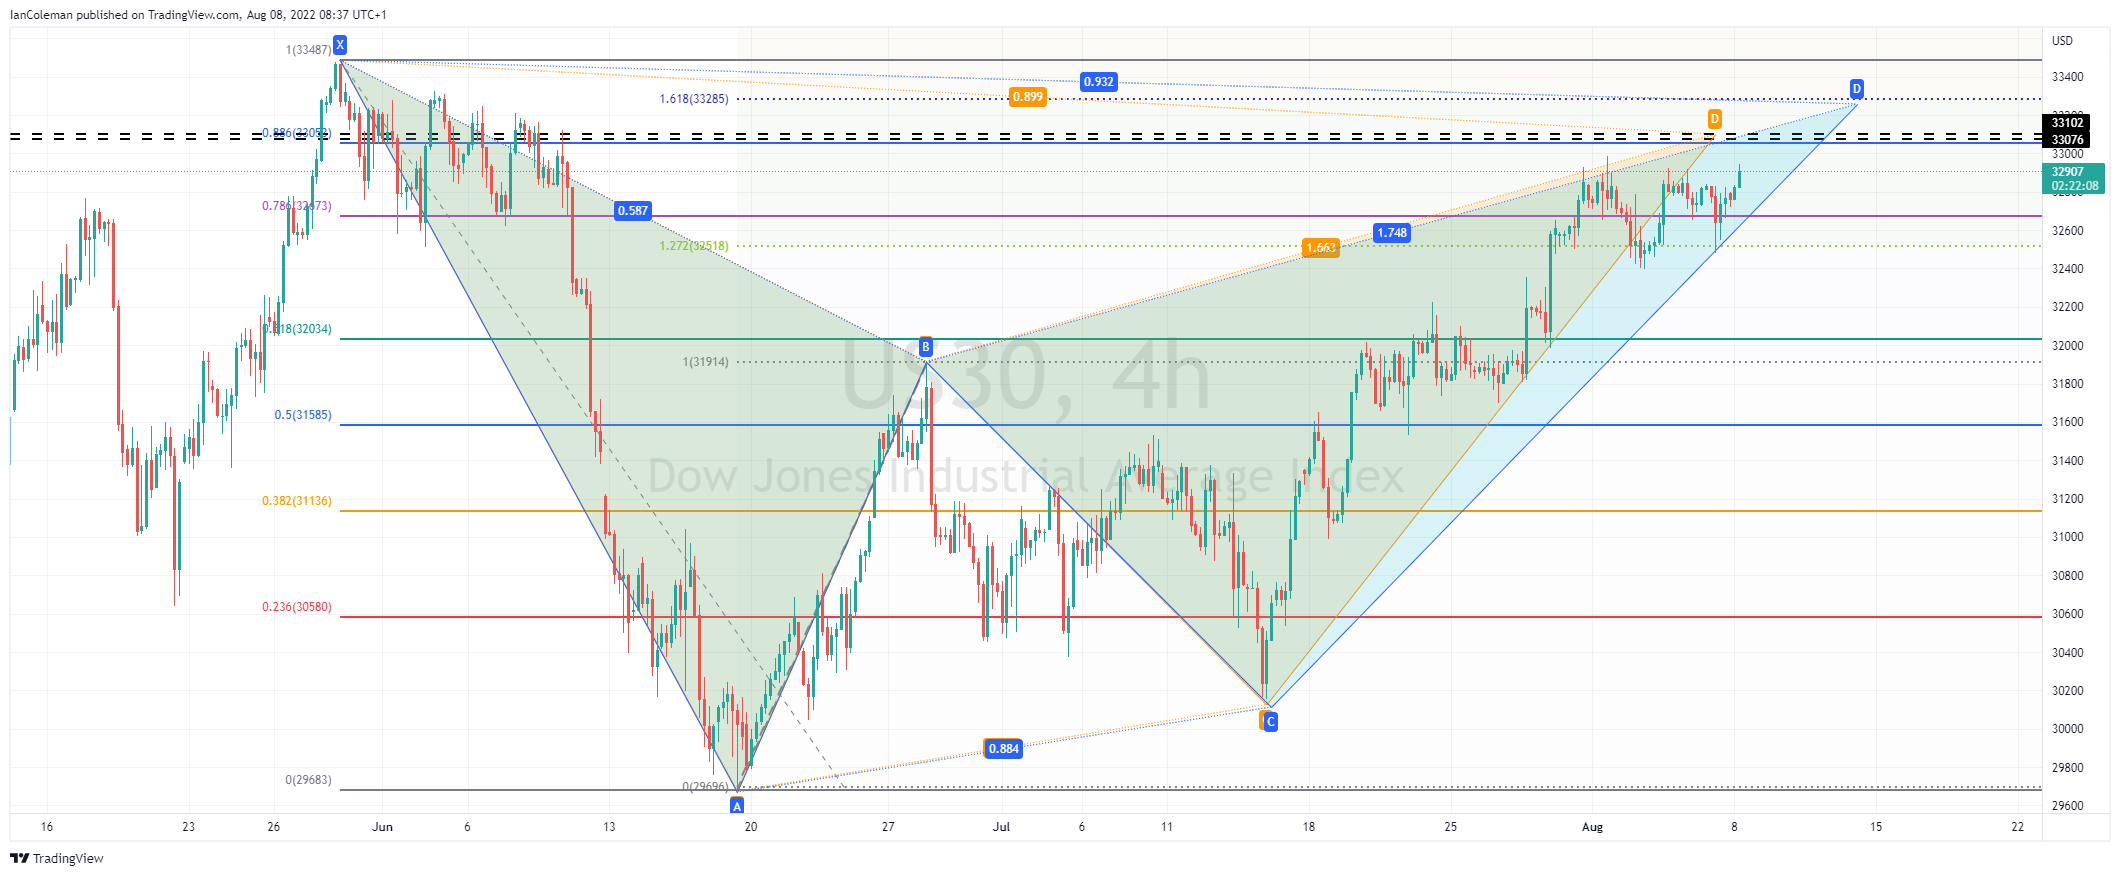
US30 four-hour chart
The intraday chart highlights a slightly dis-jointed bearish cypher pattern known as a BAT. Completion of the pattern is between 33053 (88.6%) and 33285 (161.8% rally from the first bullish wave). This will often result in a move to the downside.
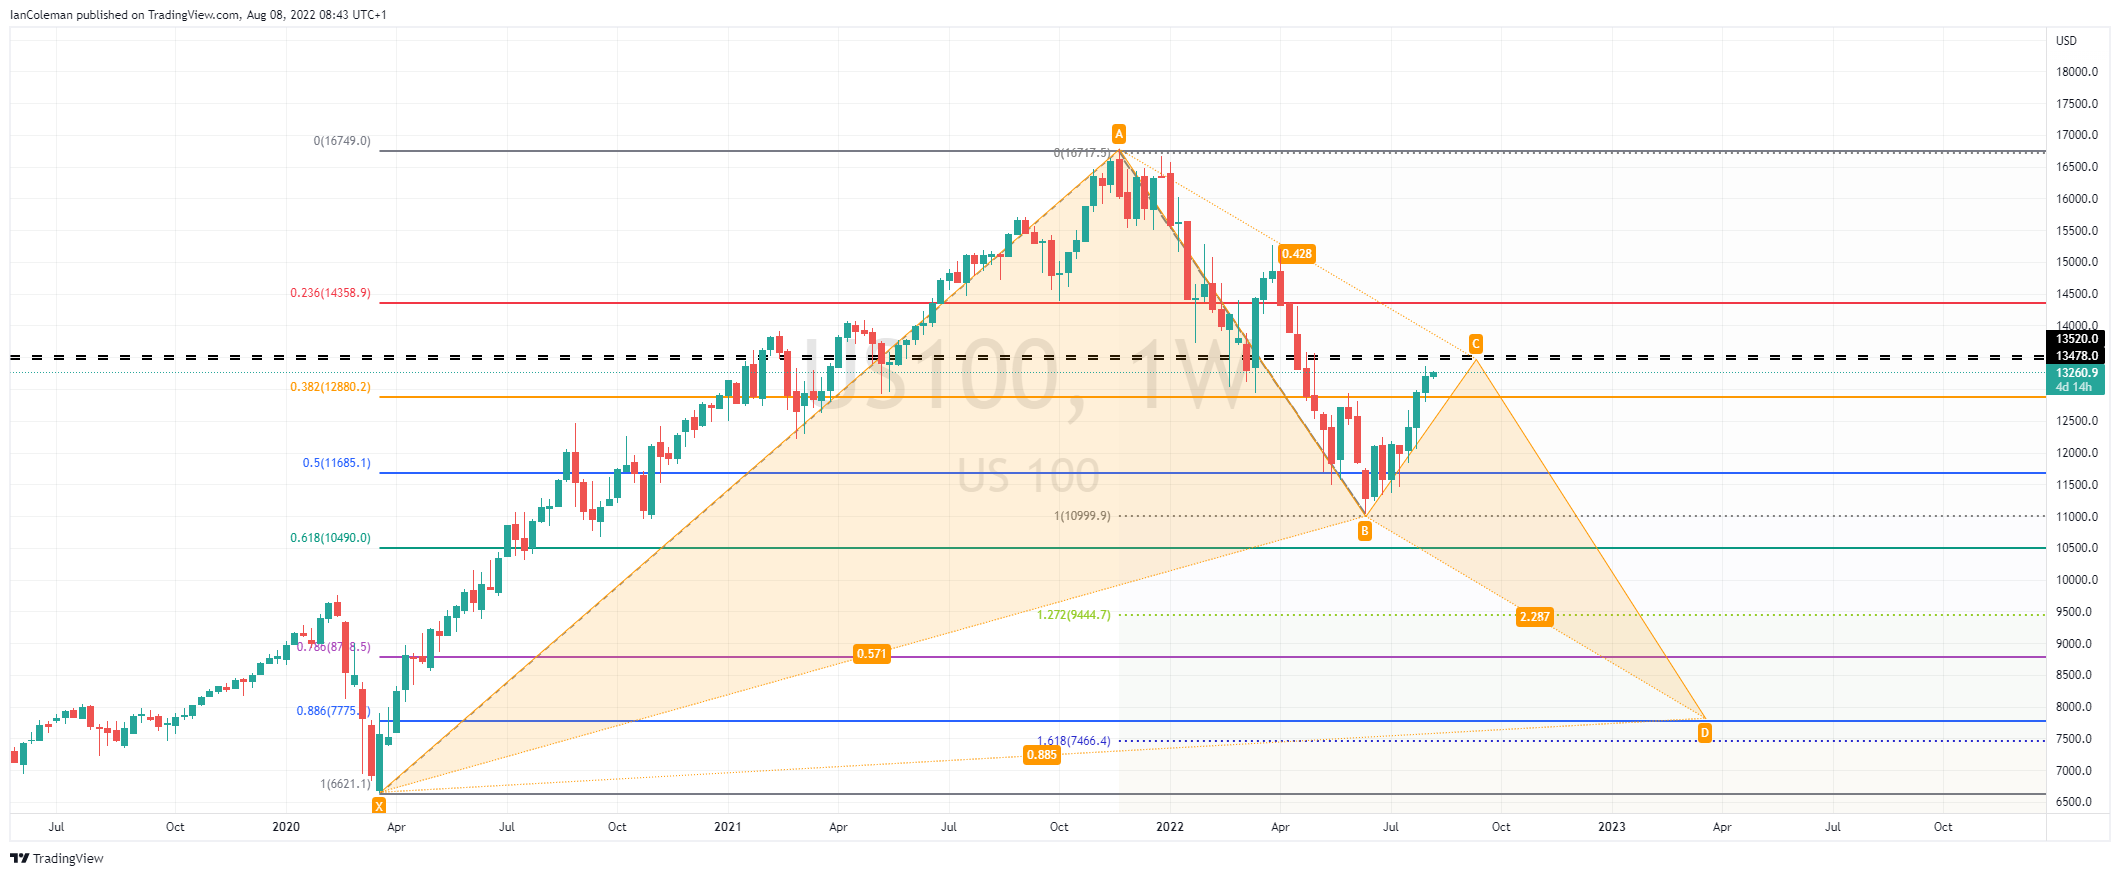
US100 weekly chart
The TL system shows bespoke resistance at 13478 and 13520. The weekly chart highlights the potential for the next move lower, in a CD leg, to complete a cypher BAT pattern close to 7775 (88.6%) and 7466 (161.8% extension from the swing low of 11039).
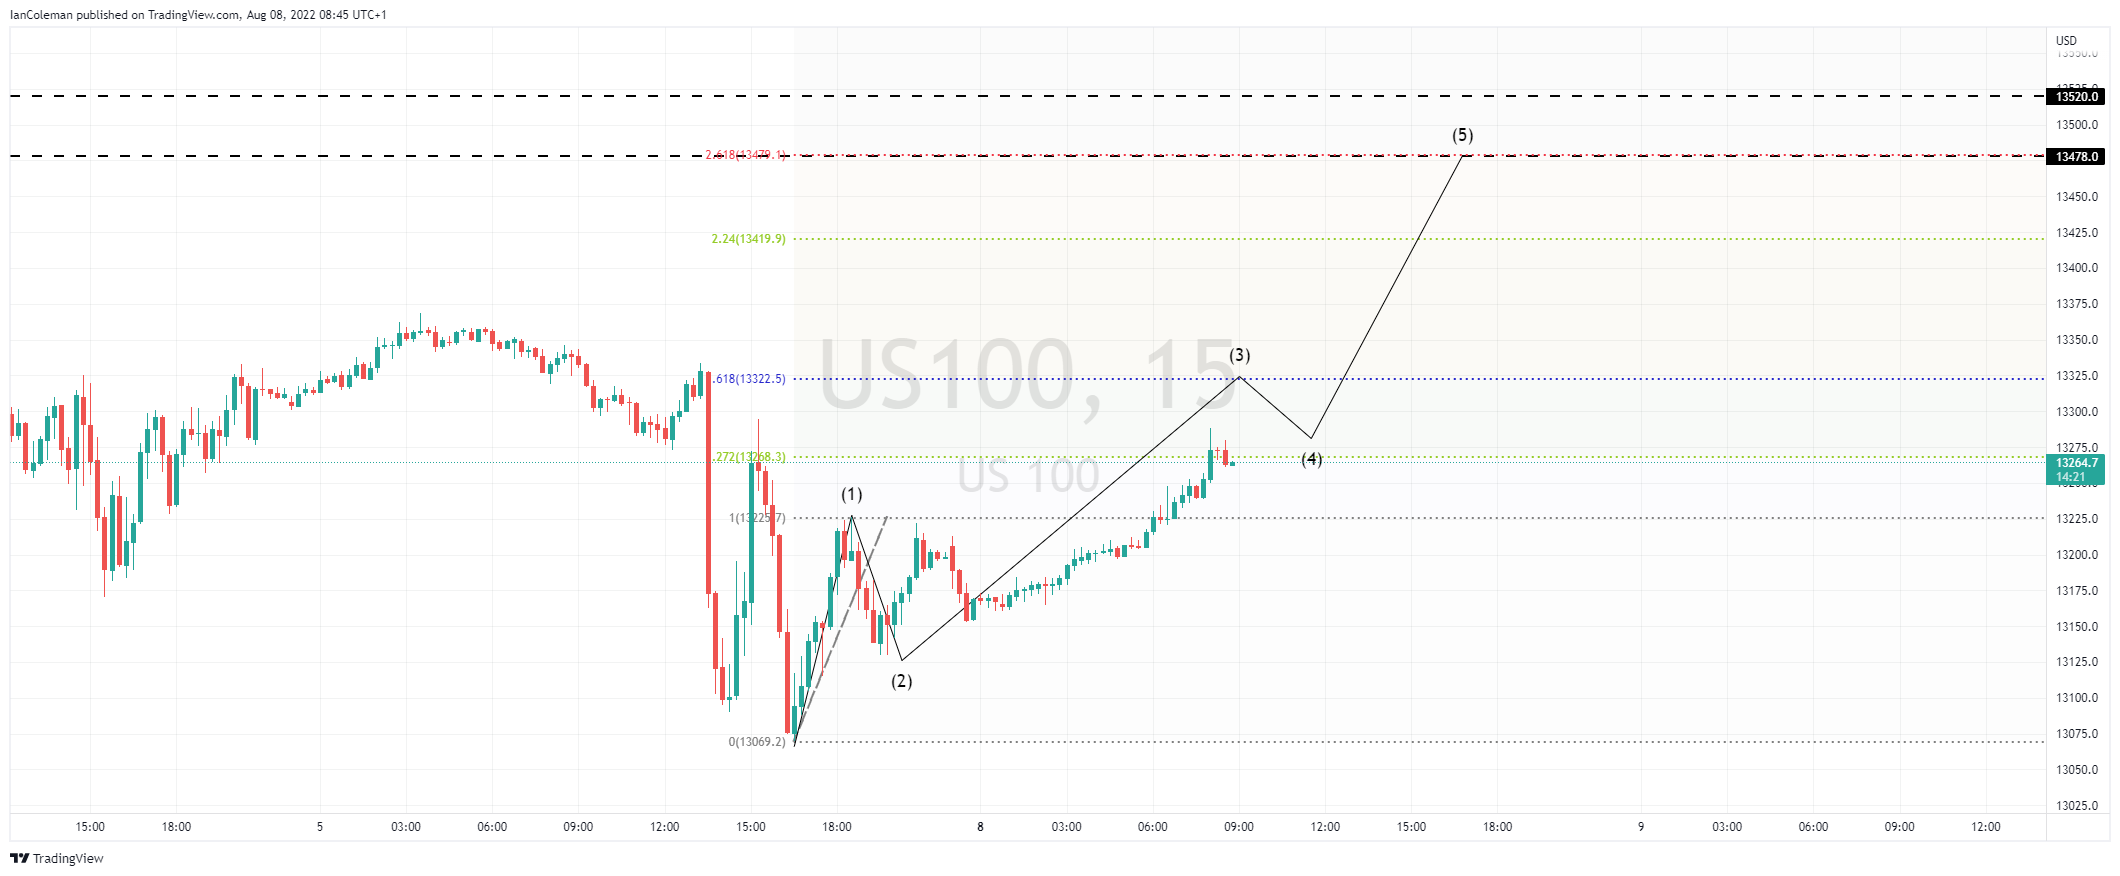
US30 intraday (15-minutes)
The intraday chart highlights a 261.8% extension level at 13479 (from 13069-13225). Elliott wave enthusiasts might consider this to be completion of a 5-wave count.
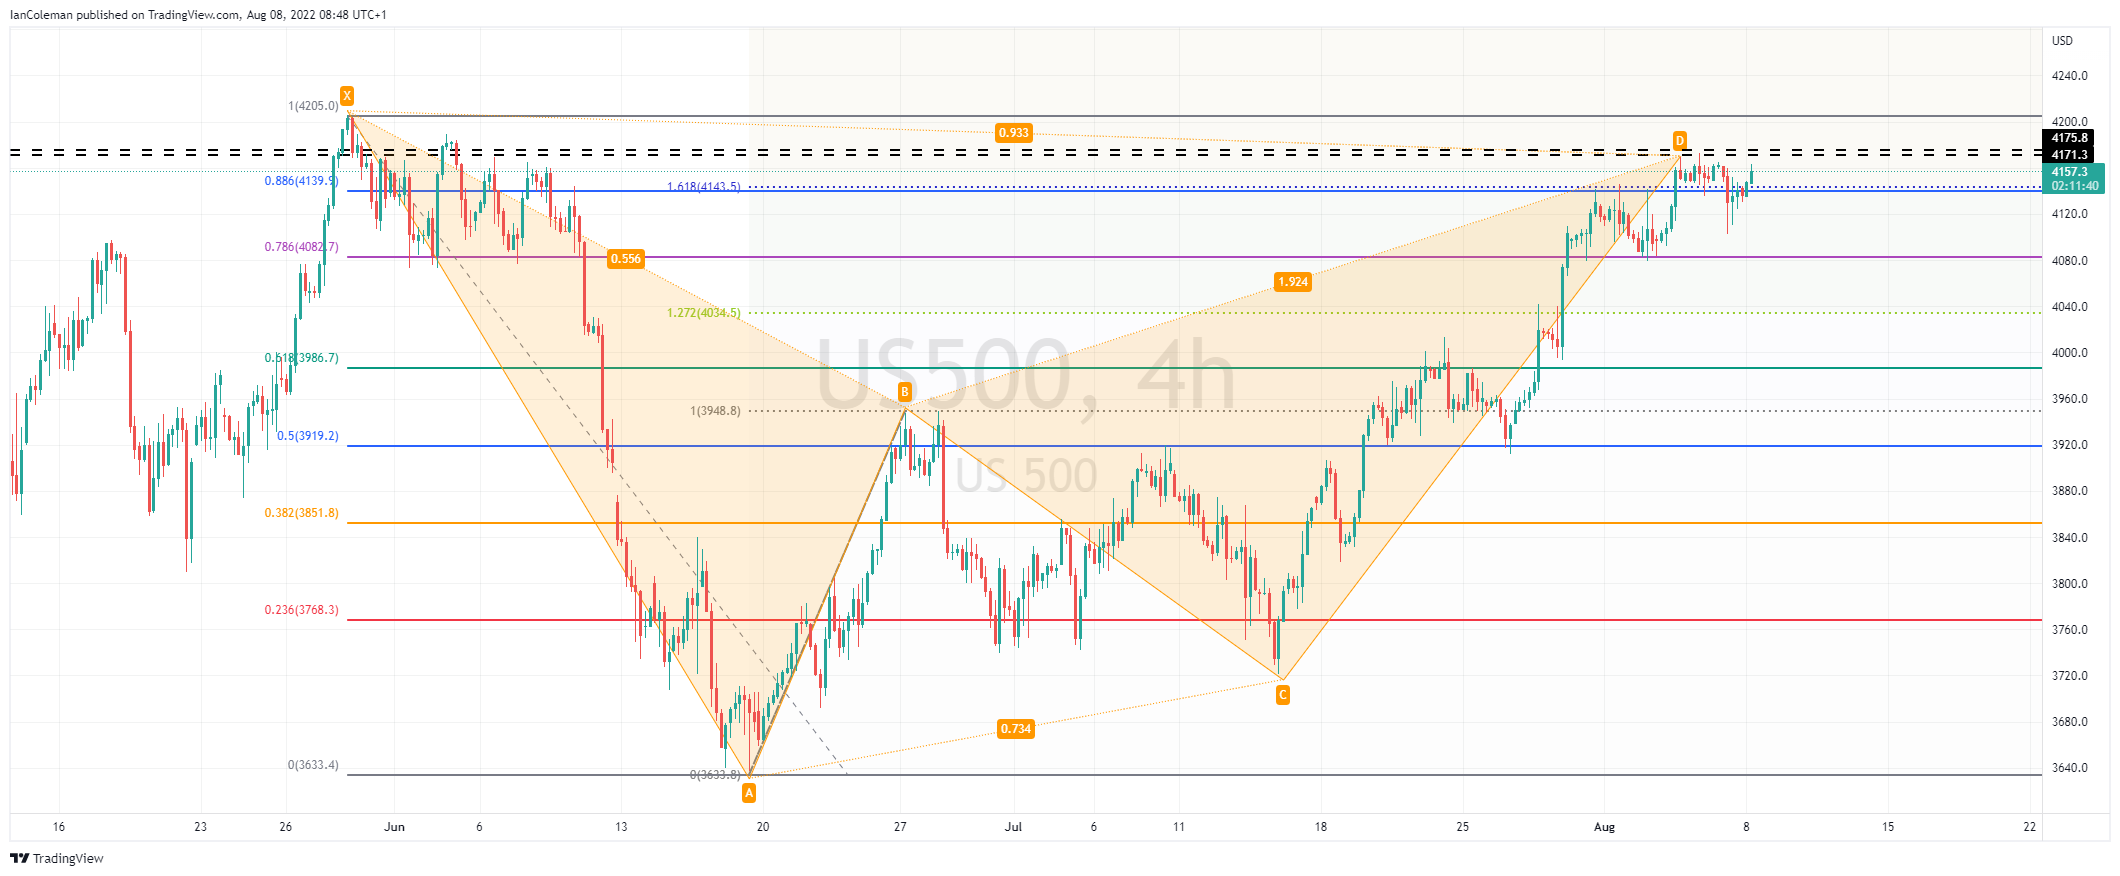
US500 four-hour chart
TL system highlights resistance at 4171 and 4176. A bearish cypher BAT pattern has been completed at 4140.
Premium
You have reached your limit of 3 free articles for this month.
Start your subscription and get access to all our original articles.
Author

Ian Coleman
FXStreet
Ian started his financial career at the age of 18 working as a Junior Swiss Broker at Godsell Astley and Pearce (London). He quickly moved through the ranks and was Desk Manager at RP Martins at the age of 29.


